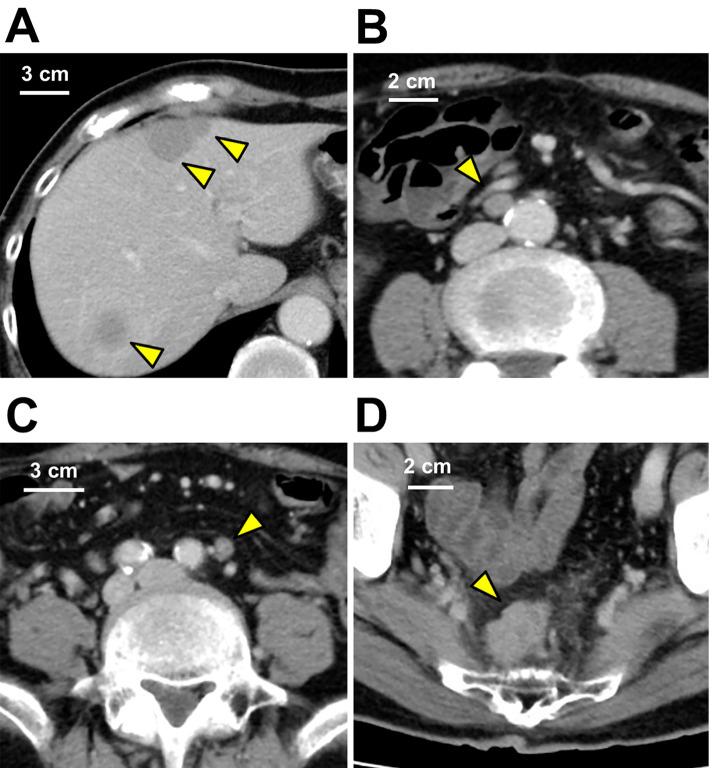
Figure 2.
Contrast-enhanced CT of the abdomen. (A) Multiple low-density areas without capsules were observed in the liver (yellow arrows). The lesions were homogeneous and showed lower density than the normal liver during the contrast phases. (B) In the para-aortic lymph node (yellow arrow) and (C) inferior mesenteric lymph node (yellow arrow), the contrast enhancement patterns were similar to those of the liver lesions, and the size had increased to 10×7 mm and 9×6 mm, respectively. (D) A nodule (yellow arrow) 25×20 mm in size was observed in the paraproctium of the upper rectum. These findings suggested that the liver lesions were metastasis from the rectal lesion.

