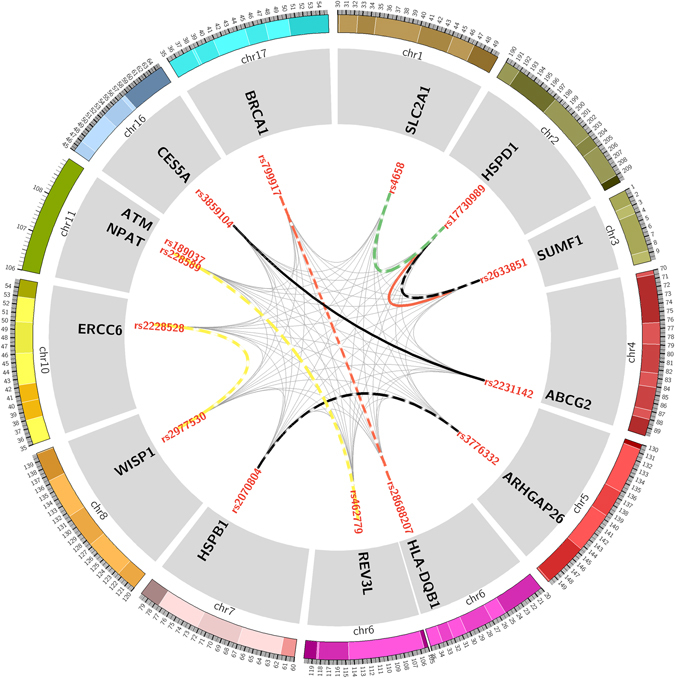
Figure 1.

Paired gene-gene interaction in discovery stage, validation stage respectively. The chromosomes are arranged end by end in a clockwise direction. The exterior of the circle is chromosome number and scale. The inner circle represents the genes of SNPs located. The innermost circle is the name of SNPs. The lines connecting two SNPs represent paired gene-gene interactions. The thinner grey lines represent interactions with no statistical significance while thicker dotted line represent interactions with statistical significance in discovery stage and thicker solid line represent interactions replicated in the validation stage. Black lines represent overall toxicity, red lines hematologic toxicity, green line sensitivity and yellow lines gastrointestinal toxicity.
