
Figure 8.
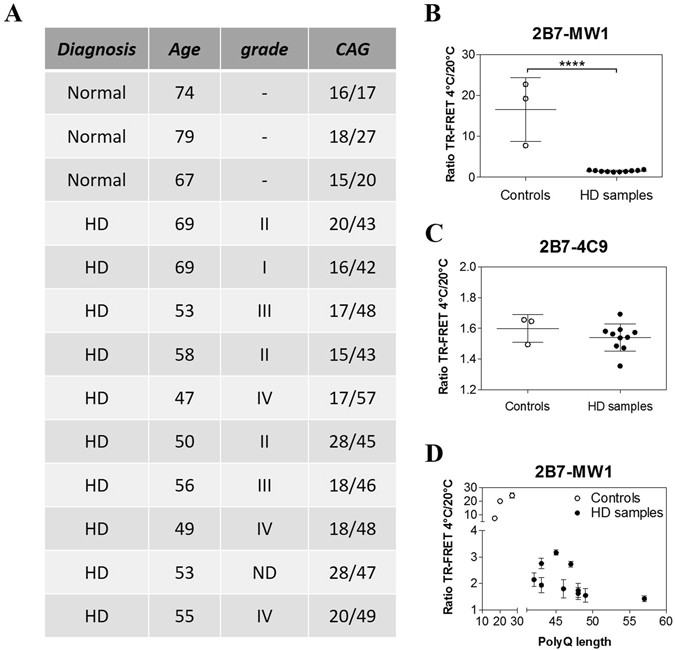
The 2B7/MW1 conformational immunoassay detects mHTT conformation in homogenates of control and HD post-mortem human brains (cortex). (A) Table illustrating the salient features of human control and HD donors of samples for this study. (B) Summary of 2B7/MW1 conformational immunoassay data (ratio TR-FRET signals at 4 °C/20 °C) obtained on homogenates of control and HD brain samples. (C) Summary of 2B7/4C9 control immunoassay data (ratio TR-FRET signals at 4 °C/20 °C) obtained on the same homogenates of control and HD brain samples. (D) Same as A, plotted against CAG (polyQ) repeat length rather than against control/HD genotype. In B and C values represent means and standard deviations of the means of three independent experiments (Datasets were tested for normality and Student’s t-test, degrees of significance are indicated). Signals obtained from TR-FRET immunoassays, preparatory for the conformational analysis, are reported in Supplementary Information: Figure S6.