
Figure 2.
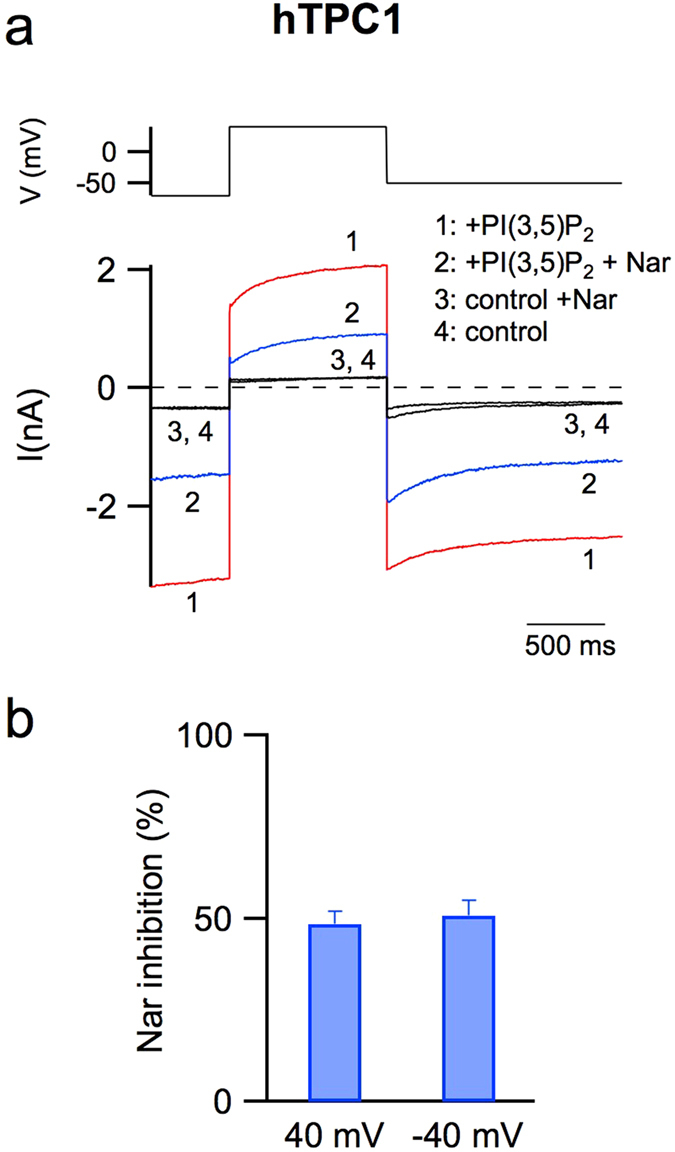
The activity of the human TPC1 channel is inhibited by naringenin. (a) Currents (lower panel) recorded in control conditions (trace 4) or adding in the cytosolic bath solution: 90 nM PI(3,5)P2 (trace 1), 90 nM PI(3,5)P2 and 500 μM Nar (trace 2), 500 μM Nar (trace 3). In the upper panel the voltage profile is shown. (b) Percentage of current inhibition induced by 500 μM Nar added in the cytosolic solution at −40 and + 40 mV. Data from 6 different vacuoles, shown as mean ± s.e.m., were not statistically significant (P > 0.6).