Figure 1.

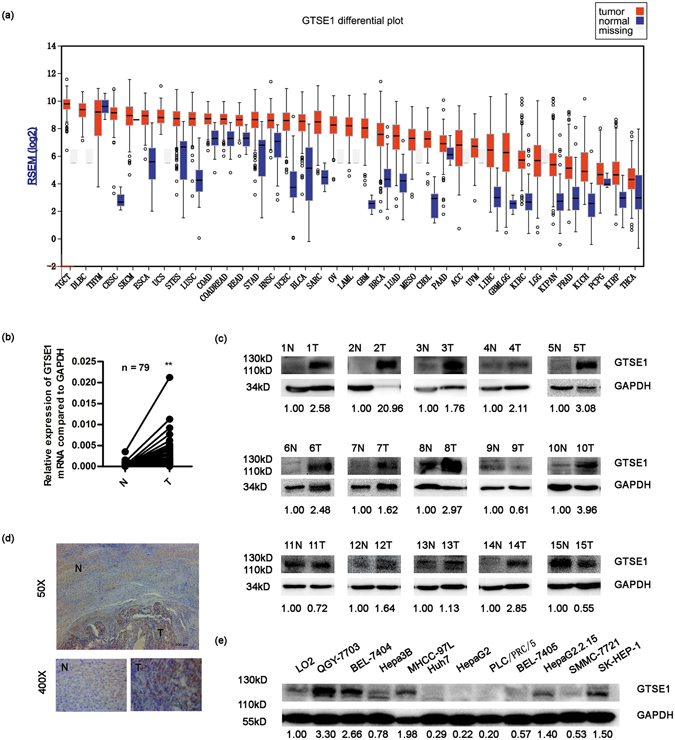
GTSE1 is frequently upregulated in HCC. (a) The mRNA levels of GTSE1 in global human cancer tissues (red) and non-tumour tissues (blue) were analysed based on the TCGA database. ACC: Adrenocortical carcinoma; BLCA: Bladder urothelial carcinoma; BRCA: Breast invasive carcinoma; CESC: Cervical squamous cell carcinoma and endocervical adenocarcinoma; CHOL: Cholangiocarcinoma; COAD: Colon adenocarcinoma; COADREAD: Colon and rectum adenocarcinoma; DLBC: Diffuse large B-cell lymphoma; ESCA: Esophageal carcinoma; GBM: Glioblastoma multiforme; GBMLGG: Glioblastoma multiforme and brain lower grade glioma (GBM + LGG); HNSC: Head and neck squamous cell carcinoma; KILH: Kidney chromophobe; KIPAN: Pan-kidney cohort (KICH + KIRC + KIRP); KIRP: Kidney renal papillary cell carcinoma; KIRC: Kidney renal clear cell carcinoma; LAML: Acute myeloid leukemia; LGG: Brain lower grade glioma; LIHC: Liver hepatocellular carcinoma; LUAD: Lung adenocarcinoma; LUSC: Lung squamous cell carcinoma; MESO: Mesothelioma; OV: Ovarian serous cystadenocarcinoma; PAAD: Pancreatic adenocarcinoma; PCPG: Pheochromocytoma and paraganglioma; PRAD: Prostate adenocarcinoma; READ: Rectum adenocarcinoma; SARC: Sarcoma; SKCM: Skin Cutaneous melanoma; STAD: Stomach adenocarcinoma; STES: Stomach and esophageal carcinoma; TGCT: Testicular germ cell tumors; THCA: Thyroid carcinoma; THYM: Thymoma; UCEC: Uterine corpus endometrial carcinoma; USC: Uterine carcinosarcoma; UVM: Uveal melanoma. (b) The mRNA levels of GTSE1 from 79 patients were tested by quantitative PCR using paired T-test. GAPDH was used as an internal control. (c) The protein levels of GTSE1 in HCC tissues and matched non-tumour tissues from 15 patients with HCC were determined by western blotting assay. Relative fold changes of T compared with N are below. (d) Immunohistochemistry analysis of GTSE1 distribution in the human liver tissues. (e) GTSE1 expression in primary HCC cell lines. Relative fold changes of HCC cell lines compared with LO2 are below. Original data are presented in Supplementary Fig. 2. N: adjacent non-tumour tissue; T: tumour tissue. Statistically significant difference: *P < 0.05, **P < 0.01.
