Figure 7.

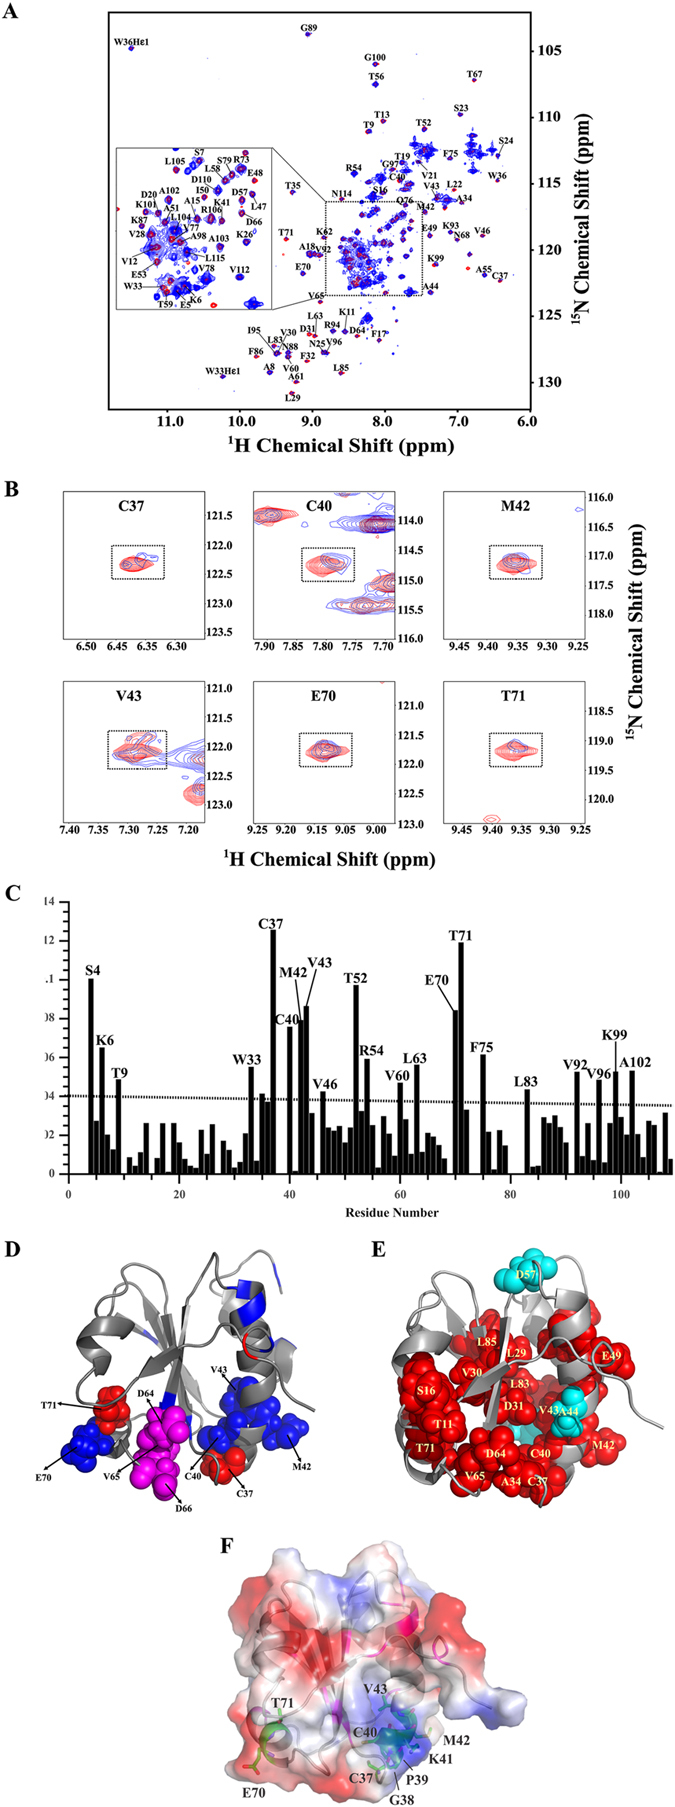
Overlayed 1H-15N HSQC-spectra of MbTrxC upon titration with MbAhpC at a molar ratio 1:2. (A) Superimposition of the 1H-15N HSQC spectrum of MbTrxC alone (red) and in the presence of MbAhpC (blue). 1H-15N HSQC-spectra were obtained on a Bruker avance 700 MHz NMR spectrometer at 298 K. Backbone resonance assignments (based on the BMRB, accession code: 17242)23 are indicated in a one-letter amino acid code and sequence number. (B) Selected sections for some residues show cross-peaks undergoing significant chemical shift perturbation. (C) Molecular interaction between MbTrxC and MbAhpC. A plot of chemical shift perturbations after addition of MbAhpC into MbTrxC at a molar ratio 1:2. Differences of chemical shifts were calculated using the following formula, Δδ = [(1Hfree − 1Hbound)2 + (15Nfree − 15Nbound)2)]1/2. (D) Ribbon representation of MbTrxC mapped by CSP results; the residues having CSP more than 0.1 are represented in red, while those showing CSP between 0.05 and 0.1 are shown in blue. Candidates for interacting residues with MbAhpC are represented as sphere model and are labeled. Additional candidates (D64-D66) based on the linewidth analysis are represented as magenta sphere. (E) Ribbon and sphere representation of MbTrxC mapped by NMR linewidths analysis; the residues showing increased in linewidth of more than 150% for NH are represented in red, while those showing increased in linewidth of more than 120% of 15N only are shown in cyan. (F) Electrostatic potential at the surface of mycobacterial TrxC (PDB ID: 2L4Q)23 with the epitopes C37-V43 and E70-T71 shown as stick representation in green and the residues involved in indirect interaction as magenta.
