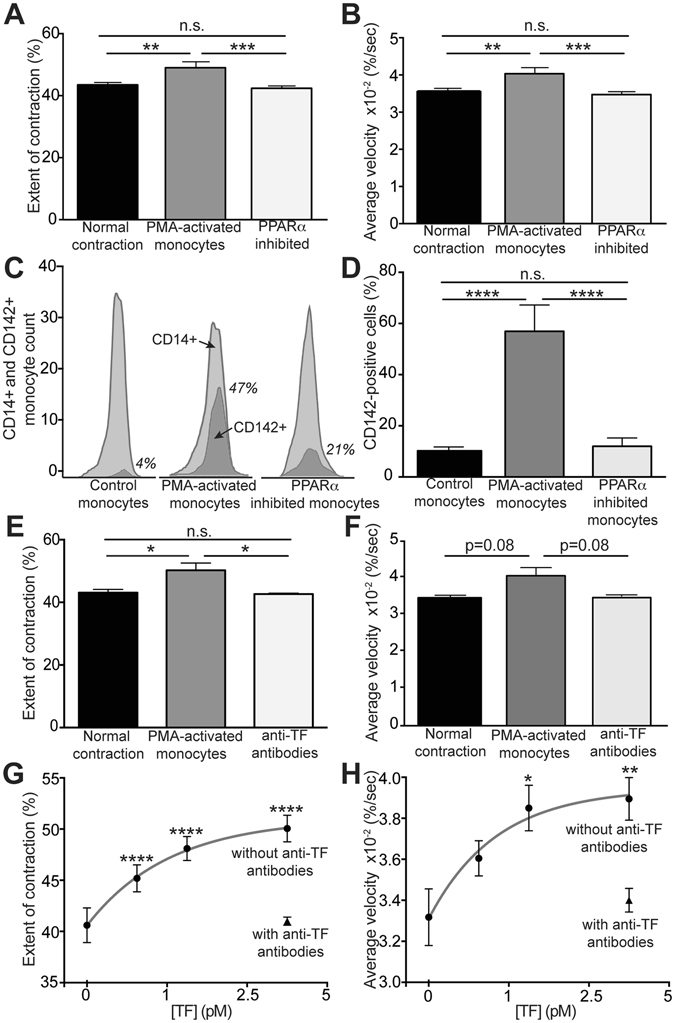
Figure 2.

Effects of cell-expressed or purified TF on clot contraction. (A) Average extent of clot contraction and (B) average velocity of clot contraction at 20 minutes after addition to whole blood of non-activated monocytes (normal contraction), PMA-activated monocytes, and PMA-activated monocytes treated with a PPARα agonist, an inhibitor of TF expression, prior to PMA activation (n = 24). (C,D) The fraction of TF-expressing (CD142-positive) monocytes determined by flow cytometry in the CD14-positive monocyte populations under various experimental conditions indicated. (C) Raw flow cytometry peaks from a representative experiment are shown. The monocyte population is shown in light gray peaks, while the fractions of TF-expressing monocytes are shown in dark gray peaks and numbers in italics. (D) The average percent of TF-expressing monocytes under various experimental conditions indicated (n = 3). (E) Average extent of clot contraction and (F) average velocity of clot contraction at 20 minutes after addition to whole blood of non-activated monocytes (normal contraction), PMA-activated monocytes and PMA-activated monocytes treated with inhibitory anti-TF antibodies (n = 3). (G) Average extent of clot contraction and (H) average velocity of clot contraction at 20 minutes after addition to whole blood of lipidated TF at a final concentration of 1 pM, 2.5 pM, and 5 pM fitted with an exponential (n = 4). The results are presented as mean ± SEM. *p < 0.05, **p < 0.01, ***p < 0.001, ****p < 0.0001.
