Figure 1.

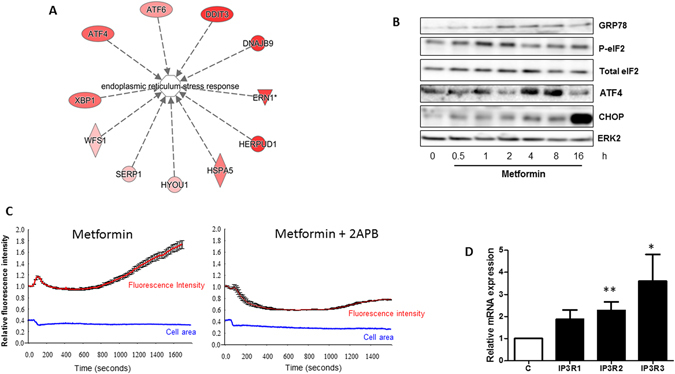
Metformin induces ER stress and calcium release from the ER. (A) List of genes related to the ER stress pathway and significantly upregulated in LNCaP cells treated with 5 mM metformin for 14 h. (B) Immunoblotting of LNCaP cells treated with 5 mM metformin for the indicated times by using antibodies directed against the indicated proteins implicated in ER stress response. The immunoblot is representative of three independent experiments. The blots represent (C) Relative fluorescence intensity of the Fluo-4AM probe, measured in LNCaP cells. 2-ABP (40 µM) was added 15 min before the addition of 5 mM metformin at time 0. The cellular area was monitored during the experiment (blue line). At least 30 single cells were monitored for each condition. The graph represents the mean fluorescence intensity +/− sem. (D) Quantification of IP3R mRNA in LNCaP cells treated with metformin for 24 h. p < 0.05 (*); p < 0.01 (**).
