
Figure 7.
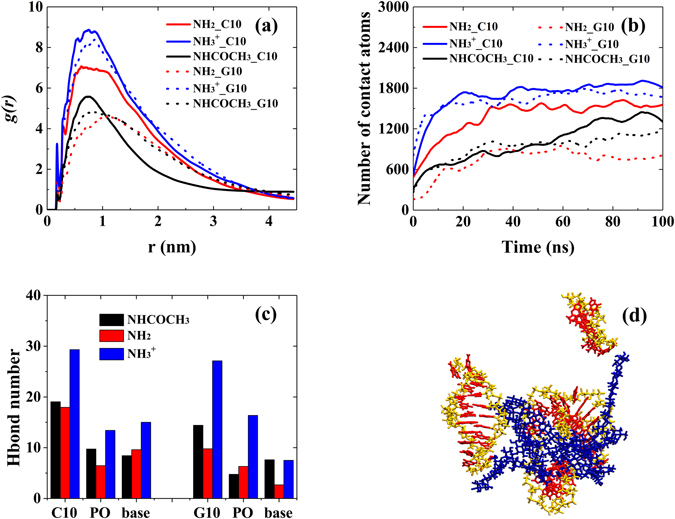
(a) The RDFs of C10/G10 around different types of chitosan. (b) Number of contact atoms between chitosan and C10/G10 as a function of simulation time. (c) Inter-molecular H-bond numbers between functional groups in chitosan and different parts of nucleotide (C10/G10: total number of H-bond formed between chitosan and C10/G10; PO: phosphate; base: guanine or cystosine). (d) The snapshots of –NH2 chitosan/G10 system at the end of 100 ns MD simulation (blue: chitosan, yellow: G10, red: base). All bases in G10 were displayed in red to better understand the role of base-base interaction in aggregation of G10. Water molecules were omitted for clarity.