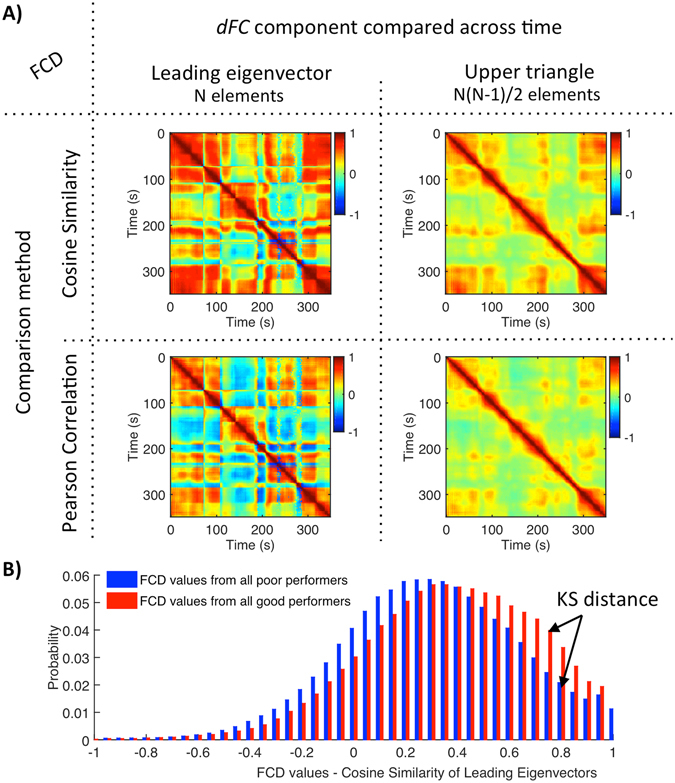
Figure 2.

FCD methods and analysis. (A) In order to capture the time-dependencies of the dFC, each entry FCD(t x, t y ) contains a measure of resemblance between the dFC at times t x and t y. This resemblance, is assessed by comparing different components of the dFC(t) (leading eigenvector, left column; upper triangular elements, right column) using either the cosine similarity (top line) or the Pearson correlation (bottom line) between components. (B) Probability densities of FCD values of all good and poor performers (N poor = 43, N good = 55) obtained using the cosine similarity of leading eigenvalues. Although all methods reveal the same temporal structure, the cosine similarity results in a better distinction between groups (i.e. larger Kolmogorov-Smirnov (KS) distance) and the leading eigenvectors capture better long-term recurrences of the same FC pattern.
