
Figure 6.
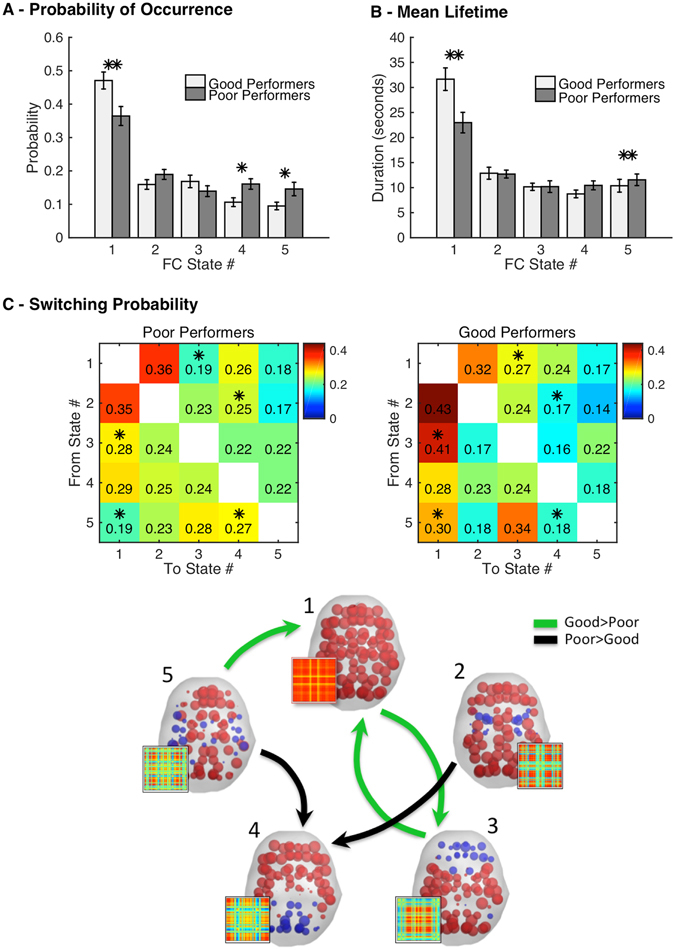
Switching between FC states relates with cognitive performance. (A) Fractional occupancy measured as the probability of occurrence of each state. The error-bars indicate the standard error. (B) Mean lifetime of each state. (C) Switching matrix indicating the probability of, being in a given FC state (lines), transitioning to any of the other states (columns). Significantly different transitions (p < 0.05) are illustrated in the plot below, with green arrows representing the transitions that occur with higher probability in good performers and in black the ones that occur with higher probability in poor performers. Each state is represented by the corresponding vector VC, displayed on cortical space (elements with the same sign in V c are colored alike). The corresponding FC pattern is illustrated on the side (V c V c T, see Methods). In A-B-C, values were estimated for each subject and then a permutation-based paired t-test was applied to test for the between-group significance. (*) and (**) indicate >95% and >99.5% confidence, respectively.