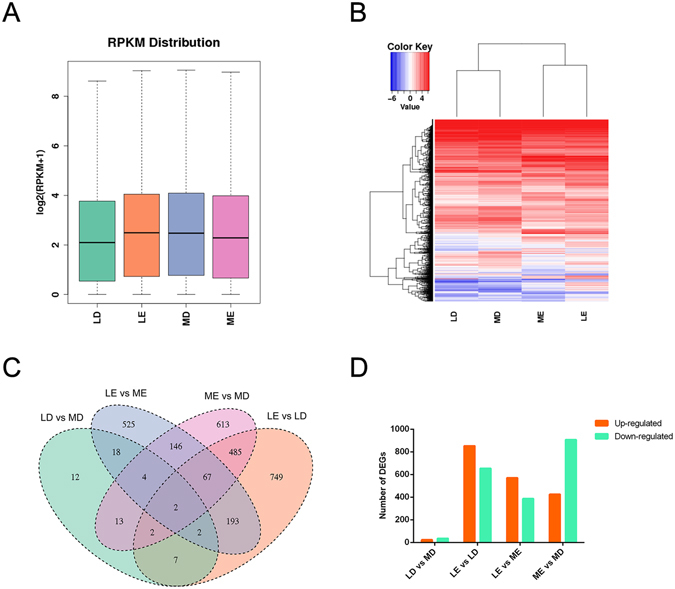
Figure 2.

Identification and analysis of DEGs of the genes expressed in follicles tissue of Large white and Mi gilts at estrus and diestrus. LD, Large white gilts at diestrus; LE, Large white gilts at estrus; MD, Mi gilts at diestrus; ME, Mi gilts at estrus. (A) Comparison of expression levels of genes detected in the LD, MD, LE, and ME groups. (B) Heatmap analysis of DEGs in the LD, MD, LE, and ME groups. (C) Venn diagram of the 2838 differentially expressed genes detected among LD vs MD, LE vs ME, LE vs LD, ME vs MD comparison groups. Different color represents different combination, the number in the overlap region represents the overlapped DEGs number. (D) Number of enriched DEGs. The orange and cyan pillars represents up-regulated and down-regulated gene number, respectively.
