
Figure 3.
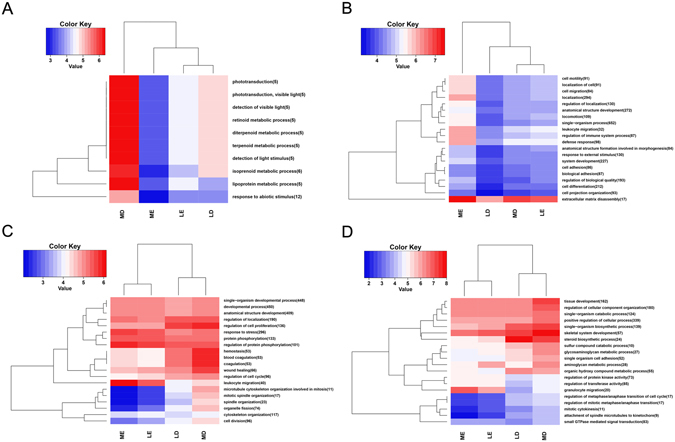
GO annotation of DEGs of the genes expressed in follicles tissue of Large white and Mi gilts at estrus and diestrus. LD, Large white gilts at diestrus; LE, Large white gilts at estrus; MD, Mi gilts at diestrus; ME, Mi gilts at estrus. DEGs number of the most enriched 20 GO terms derived from biological processes from LD vs MD (A), LE vs ME (B), LE vs LD (C), ME vs MD (D) comparison groups, respectively. Red shows higher expression and blue shows lower expression. The figures in parentheses refer to the number of DGEs in this term.