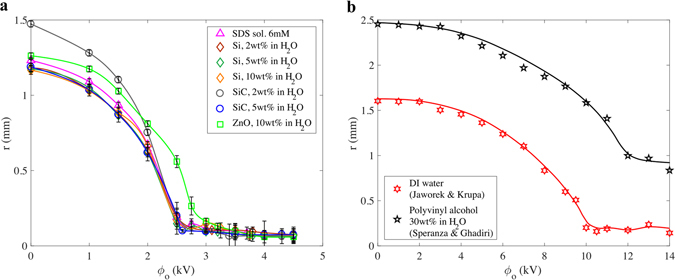
Figure 3.

Droplet size vs applied electrical voltage. (a) Markers represent the average droplet radius as a function of the applied voltage between the capillary tube and the earthed electrodes. Error bars show the uncertainty of the measurements with a confidence interval of 95%. Solid curves are produced by curve fitting the experimental results. (b) Other investigators’ data. Jaworek & Krupa’s results19 (red stars) are adapted from their Fig. 3a. Speranza & Ghadiri’s results31 (black stars) correspond to their electrode configuration C. Solid curves are produced by curve fitting the experimental data.
