
Figure 2.
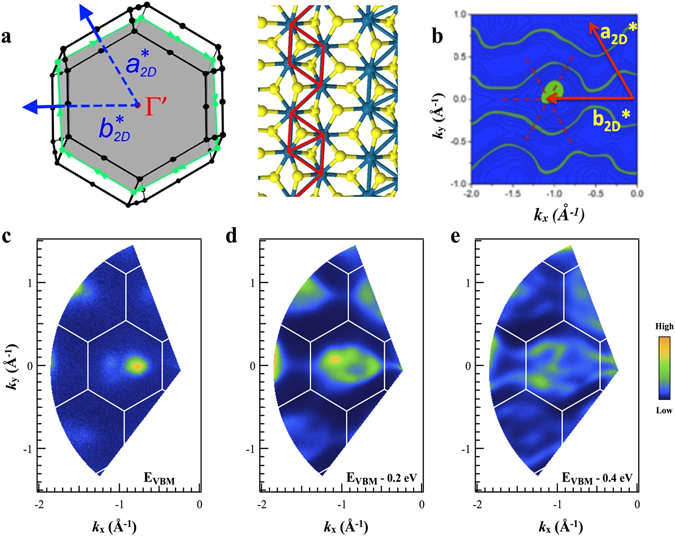
ARPES maps of photoemission intensity as a function of in-plane wavevector (a) View along the c * axis of the first Brillouin zone, showing the irregular hexagon (gray) defined by a and , and top view of a single ReSe2 layer indicating the orientation of the chains with respect to the Brillouin zone. (b) A theoretical contour plot at 0.4 eV below the valence band maximum. The dotted cross indicates the position of a Γ’ point. For comparison, in Figure S1 of the supplementary information all experimental contour plots are compared with the corresponding theoretical ones. (c–e) Experimental maps (c) near the valence band maximum (VBM); (d) 0.2 eV below the VBM and (e) 0.4 eV below the VBM.