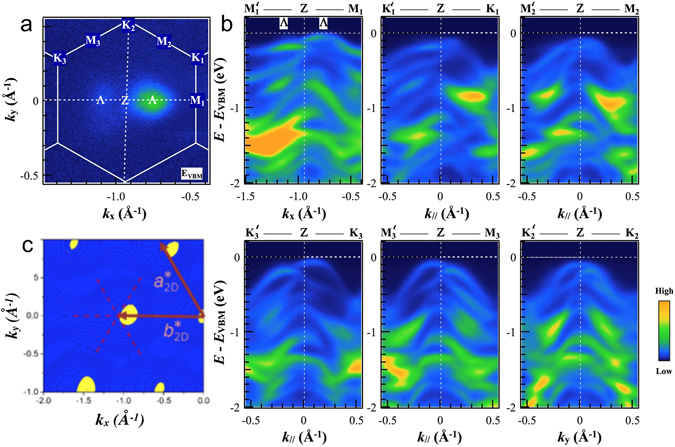
Figure 3.

Electronic band structure of ReSe2 (a) ARPES constant energy plots measured with 100 eV photon energy throughout the reciprocal unit ReSe2 cell. Experimental photoemission signal as a function of in-plane momentum at an energy close to the VBM for a section through the Brillouin zone passing through the Z point, showing the special points of the quasi-Brillouin zone including the position of the local VBM (labelled Λ) (b) ARPES data along the M’ZM and K’ZK directions in the reciprocal space. (c) DFT calculations of the density of states at the top of the valence band in the plane containing the Z point, in good agreement with experimental results shown in panel (a).
