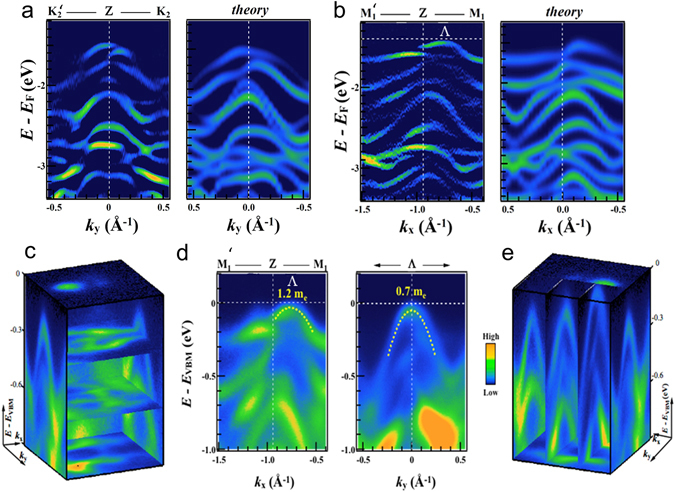
Figure 4.

Valence band dispersion. (a) Measured and calculated dispersions along the direction and (b) normal to it. In (a) and (b), the colour scale of the calculated data is arbitrary but in the same sense as the experimental data and indicates the projection of the VB states onto the Re d orbitals. (c) and (e) panels show the same data of panels (a) and (b) in 3D plots. (d) Dispersion measured by ARPES along the direction (left) and normal to it (right) passing through the point Λ. Fitted dispersions are shown as dashed lines, giving the effective masses at Λ in these two directions.
