
Figure 5.
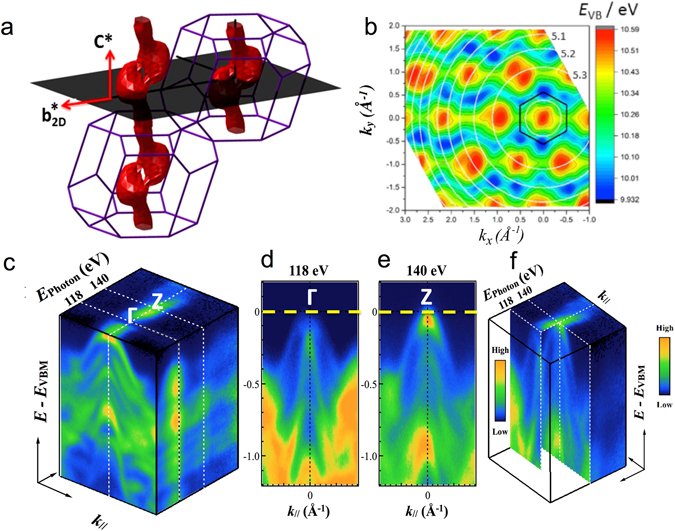
Three-dimensional electronic band structure of the ReSe2 (a) Perspective view of the Brillouin zone: red surface: the constant energy surface for the valence band states at 80 meV below the valence band maximum. The shaded plane shows a plane parallel to the crystal layers; this is the plane sampled in an ARPES experiment at a given excitation phonon energy (neglecting the curvature due to momentum conservation discussed in the text). (b) Energy E VB of the highest-lying valence band state as a function of in-plane momenta k x and k y, calculated taking into account the variation of the momentum k z normal to the layer expressed by equation 1. White circles indicate contours of constant k z (three are labelled, top right, by their values in units of 2π/c*) and the black hexagon shows the in-plane quasi-unit cell of Fig. 1(c) and (f) nano-ARPES signal (blue = low to orange = high) as a function of energy below the Fermi energy (vertical axis) and in-plane momentum k xy, for excitation energies of 118 and 140 eV (left and right respectively). (d) and (e) panels show the nano-ARPES electronic dispersion of the valence bands at the Γ and Z points of the 3D Brillouin unit cell.