
Figure 3.
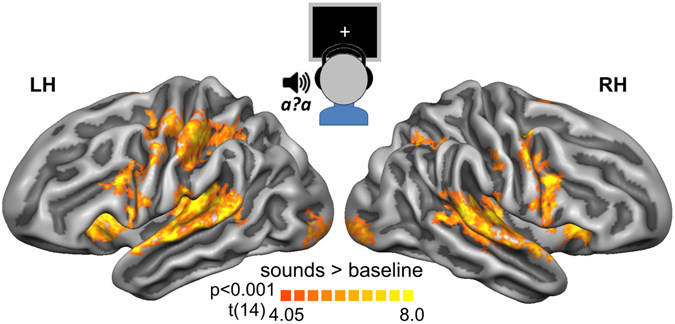
fMRI activity during auditory post-test trials. Functional maps illustrating activity evoked by the ambiguous post-test speech sounds. The maps are based on random effects contrasts, corrected for multiple comparisons using cluster size correction (pcorr < 0.05) with a primary threshold of pvertex = 0.001, and visualized on cortical surface representations of the left (LH) and right (RH) hemispheres (light grey: gyri and dark grey: sulci), resulting from the realignment of the cortices of our 15 participants.