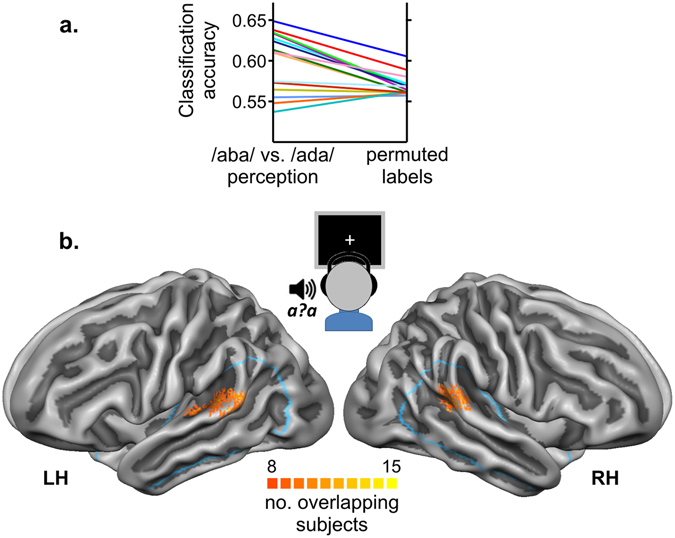
Figure 4.

fMRI decoding of the auditory post-test trials. (a) Classification accuracies for each of our 15 individual participants. Accuracies obtained with the perceptual labels (/aba/ vs. /ada/ perception) were significantly higher (p = 0.0043) than the accuracies based on permuted labels following the exact same decoding procedure. (b) Discriminative maps that illustrate for how many subjects vertices were among the 20% most discriminative features for decoding /aba/ vs. /ada/ perception. Blue outlines delineate the anatomical temporal cortex masks (ROIs) within which fMRI decoding was performed. Maps are visualized on the aligned group-averaged cortical surface representations of the left (LH) and right (RH) hemispheres.
