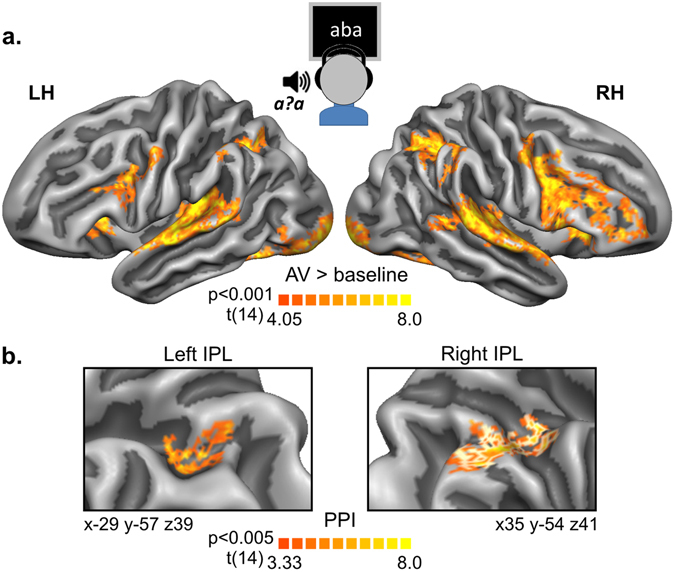
Figure 5.

fMRI activity and connectivity during audiovisual exposure blocks. (a) Functional contrast maps illustrating overall BOLD responses during the audiovisual (AV) exposure blocks, corrected for multiple comparisons using cluster size correction (pcorr < 0.05) with a primary threshold of pvertex = 0.001. (b) Psychophysiological interaction (PPI) maps during the AV exposure blocks showing significant clusters in the left and right inferior parietal lobe (IPL) with normalized areas of 58 and 181 mm2 respectively. Talairach coordinates (xyz) refer to the centre of gravity of the IPL regions. Maps are corrected for multiple comparisons using cluster size correction (pcorr < 0.05) with a primary threshold of pvertex = 0.005. At a primary threshold of pvertex = 0.001 only the right IPL cluster survives (white outlines). All maps are based on random effects contrasts and visualized on group-averaged and aligned cortical surface representations of the left (LH) and right (RH) hemispheres.
