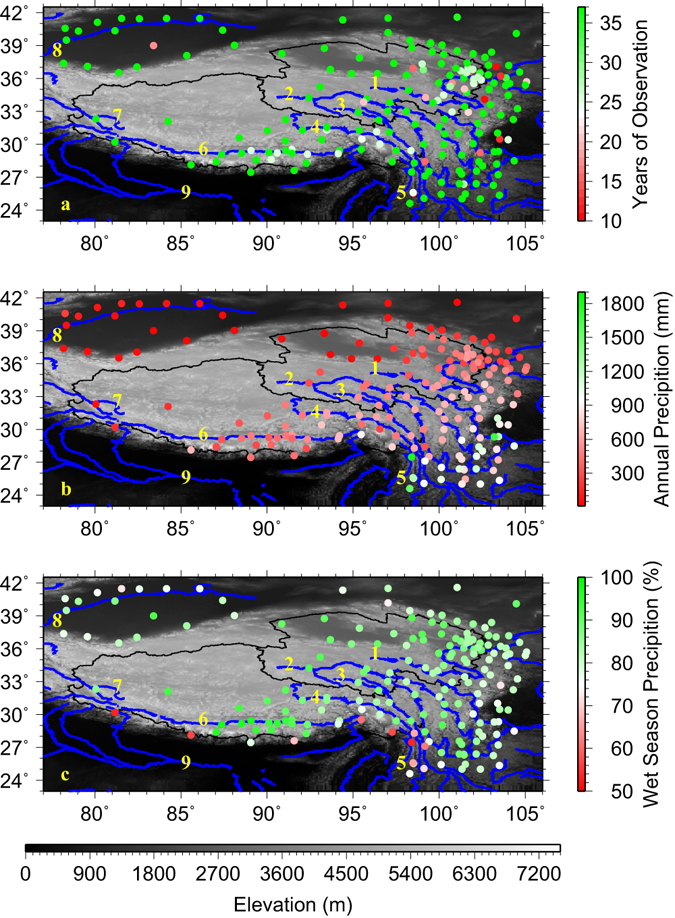
Figure 2.

Geographic locations and number of years of observation for 185 stations that have observation periods longer than 10 years during 1979–2015 (a); mean annual precipitation at the 185 stations during 1979–2015 (b); percentage of wet season (May–September) precipitation to annual total precipitation at the 185 stations (c). Black lines denote the boundaries of the Qinghai Province on the northeastern and the Tibetan Autonomous Region on the southwestern TPS. Blue lines and the numerical numbers represent the 9 major rivers that originate from the TPS: 1: the Yellow River, 2: the Yangtze River, 3: the Mekong River, 4: the Salween River, 5: the Irrawaddy River, 6: the Brahmaputra River, 7: the Indus River, 8: the Tarim River, and 9: the Ganges River. This figure was plotted using the Generic Mapping Tools (GMT) V4.5.0 (https://www.soest.hawaii.edu/gmt/).
