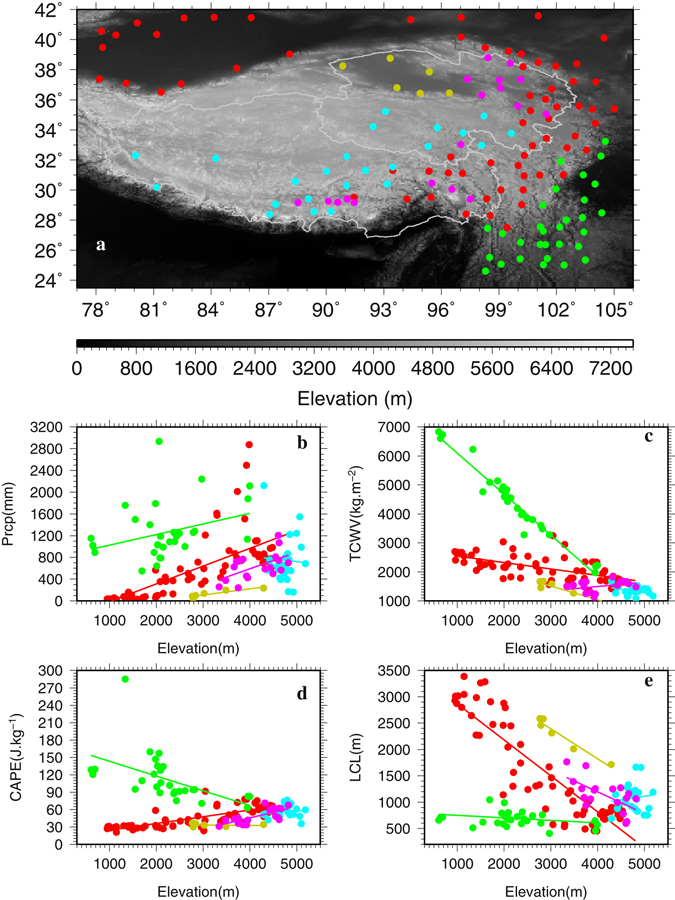
Figure 5.

Locations of the MERRA2 cells whose wet season precipitation is correlated statistically significantly at 90% confidence level with that of the corresponding stations (a). Vertical distributions of wet season precipitation (b), total column water vapor (TCWV) (c), convective available potential energy (CAPE) (d), and lifting condensation level (LCL) (e) with MERRA2 elevation for the MERRA2 cells that are separated into the same color-coded 5 groups as for the observations. This figure was plotted using the Generic Mapping Tools (GMT) V4.5.0 (https://www.soest.hawaii.edu/gmt/).
