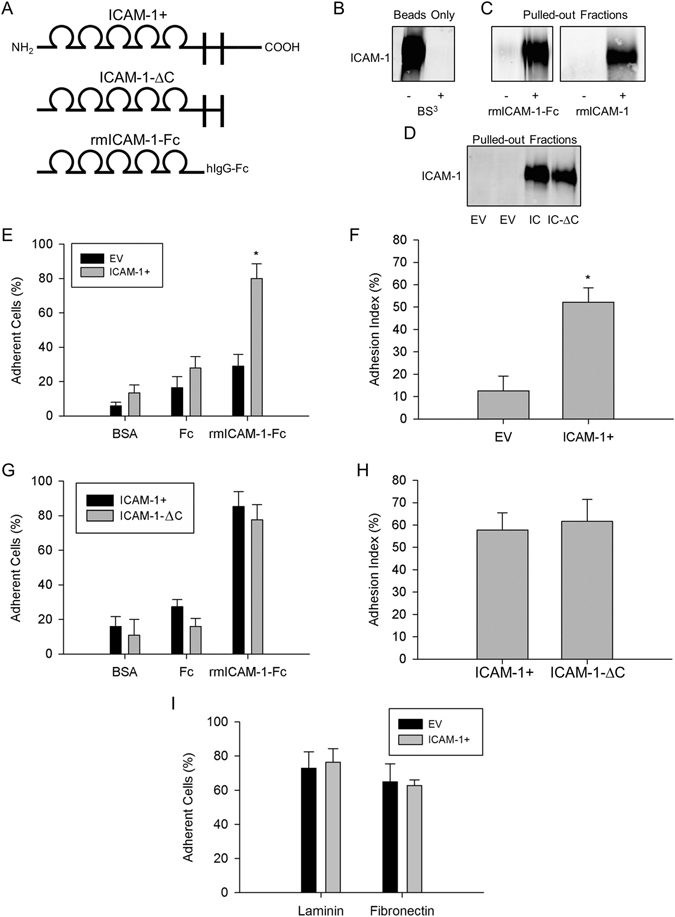
Figure 1.

ICAM-1-ICAM-1 interactions in myoblast adhesion. (A) Structure of ICAM-1 in ICAM-1+ and ICAM-1-∆C cells, as well as rmICAM-1-Fc. Cartoon depicts the 5 extracellular IgG-like domains, transmembrane segment, and the cytoplasmic domain of ICAM-1. (B) Western blot for ICAM-1 in beads coated with rmICAM-1-Fc. BS3 was used to covalently link rmICAM-1-Fc to beads. The cropped area corresponds to 150–100 kDa and the ICAM-1 band appeared at ~110 kDa. (C) Beads crosslinked with ICAM-1 were incubated with PBS-T, rmICAM-1-Fc or rmICAM-1. ICAM-1 was detected in pulled-out fractions via western blotting. (D) Western blots for ICAM-1 in pulled-out fractions of EV, ICAM-1+ (IC), and ICAM-1-∆C (IC-∆C) myoblasts. (E) The percentage of EV and ICAM-1+ myoblast that adhere to bovine serum albumin (BSA), rhIgG1-Fc (Fc), or rmICAM-1-Fc. *Higher for ICAM-1+ compared to EV myoblasts for rmICAM-1-Fc (interaction effect; p < 0.005). (F) Adhesion index for EV and ICAM-1+ myoblasts. *Higher (p < 0.005) for ICAM-1+ compared to EV myoblasts. (G) The percentage of ICAM-1+ and ICAM-1-∆C myoblasts that adhere to BSA, Fc, and rmICAM-1-Fc. (H) Adhesion index for ICAM-1+ and ICAM-1-∆C myoblasts. (I) The percentage of EV and ICAM-1+ myoblasts that adhere laminin and fibronectin (p = 0.56). n = 4 replicates for each experimental condition and data set.
