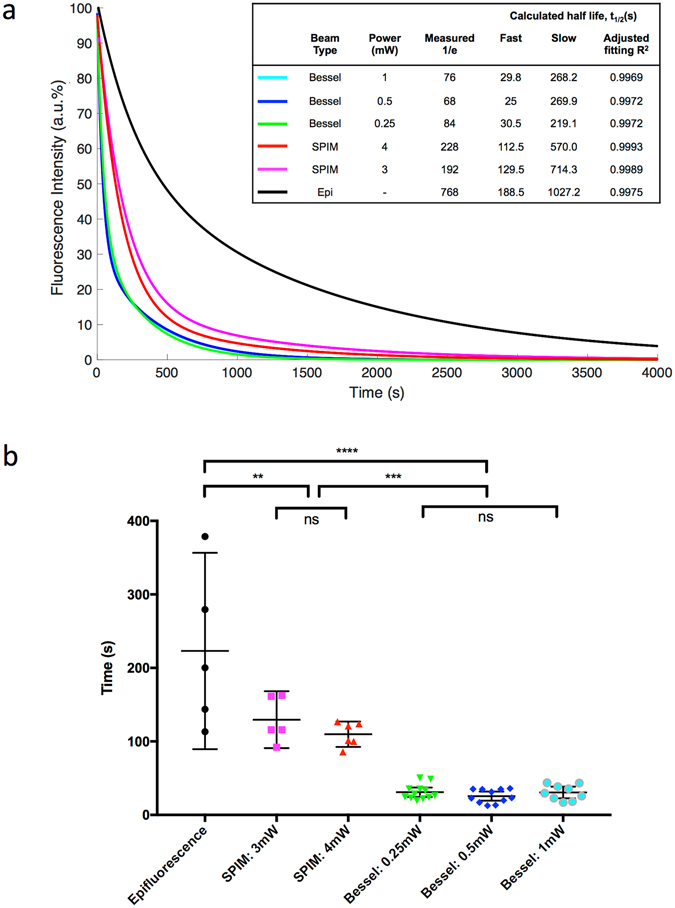
Figure 3.

Fitting of decay curves highlights distinction between targeting speed. (a) Averaged fluorescence intensity profiles for each group were fitted to two-term exponential functions. The calculated fast and slow decay curve half-lives were calculated and are show, along with the measured time for the curve to reach 1/e. The curve fitting precision is represented by the adjusted R2 value. (b) Individual fluorescence intensity decay curves were fitted to two-term exponential functions for each sample. KillerRed photobleaching follows this two-term decay curve extremely well, comprising a fast and a slow decay component. The half-life was calculated from the fast term of each fitted curve, and averaged for each group. Individual points are plotted, with error bar designating the 95% confidence intervals. **p < 0.01, ****p < 0.0001.
