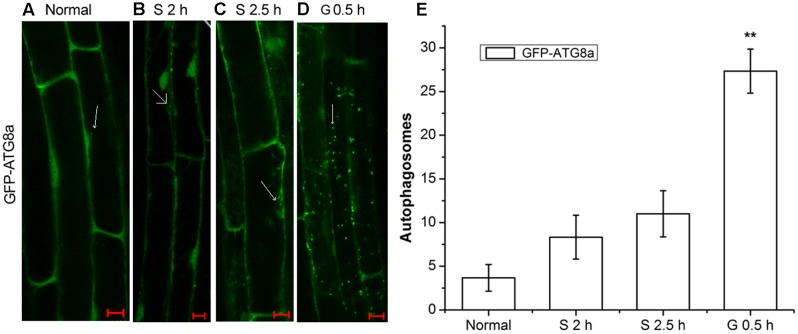
FIGURE 1.
The observation of autophagosomes. Autophagosomes labeled by GFP-ATG8a in root cells of GFP-ATG8a plants with incubation in 1 μM CA. (A) Normal seedlings. (B) Starved seedlings for 2 h. (C) Starved seedlings for 2.5 h. (D) Starved seedlings for 2 h stimulated by 6% D-glucose for 0.5 h. (E) Quantification of the GFP-ATG8a-labeled autophagosomes per cell. Root cells at the indicated times was used to calculate the autophagic activity. The mean and SD values were calculated from roots of six seedlings per time point. Results in three parallel experiments were used for the quantification. The asterisks indicate significant differences from the starved seedlings treated with D-glucose for 0 h. Scale bars, 10 μm (∗∗P < 0.01).

