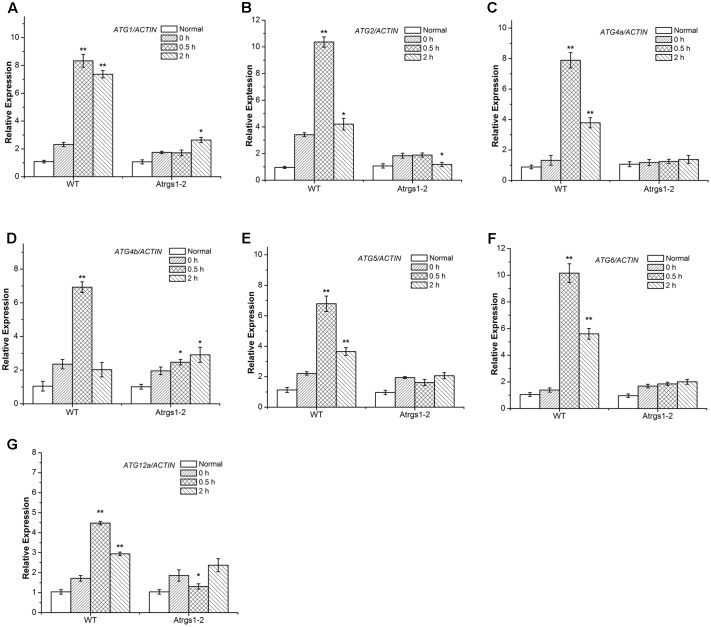
FIGURE 3.
Expression of autophagy related genes in Atrgs1–2 and wild-type (WT) in response to D-glucose. Expression of ATG1 (A), ATG2 (B), ATG5 (C), ATG4a (D), ATG4b (E), ATG6 (F), ATG12a (G) in normal conditions and D-glucose treatment for 0, 0.5, and 2 h. Total RNA isolated from Atrgs1–2 and WT was subjected to qRT-PCR using gene-specific primers. Data represent mean and SD of at least three independent experiments. The asterisk indicates a significant difference from the starved seedlings treated with 1% D-glucose for 0 h (∗P < 0.05 or ∗∗P < 0.01).

