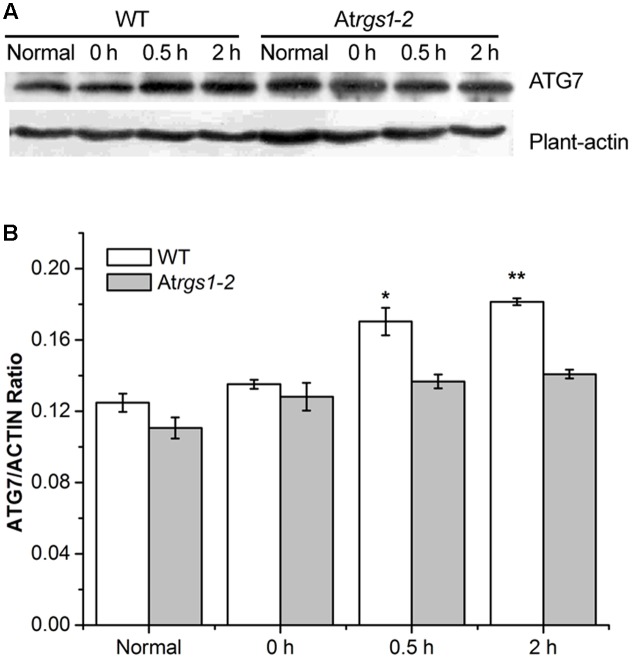
FIGURE 4.
Immunoblots depicting the level of ATG7 protein in WT and Atrgs1–2. Total proteins were extracted from treated seedlings at the indicated hours (normal seedlings, starved seedlings stimulated by 1% D-glucose for 0, 0.5, and 2 h). (A) Detection of ATG7 protein in WT and Atrgs1–2. Equal amounts of protein were used to western blotting with anti-ATG7 antibodies, β-actin was subjected to the loading control. (B) Quantification of changes in ATG7 expression normalized with plant-actin. Images represented at least three independent experiments. Asterisks indicate significant differences from the starved seedlings treated with 1% D-glucose for 0 h at ∗P < 0.05 or ∗∗P < 0.01.

