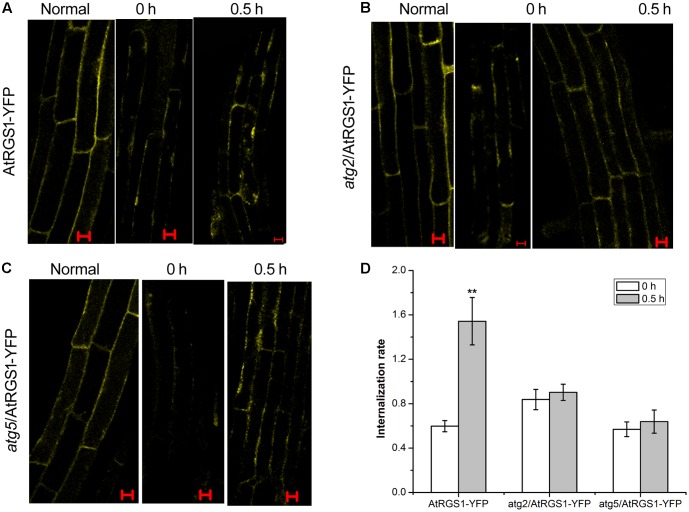
FIGURE 6.
Confocal imaging of endocytosis of AtRGS1 in the plant of AtRGS1-YFP (A), atg2/AtRGS1-YFP (B), atg5/AtRGS1-YFP (C) (normal seedlings, starved seedlings stimulated by 6% D-glucose for 0 and 0.5 h). Scale bars represent 10 μm. (D) Quantification of AtRGS1-YFP internalization rate. Internalization rate was calculated by dividing the internalization of the starved seedlings treated with D-glucose for 0 or 0.5 h by the internalization of the normal seedlings. Experiments were performed three independent replicates with similar results. Asterisks, significant differences from the starved seedlings treated with D-glucose for 0 h, ∗∗P < 0.01.

