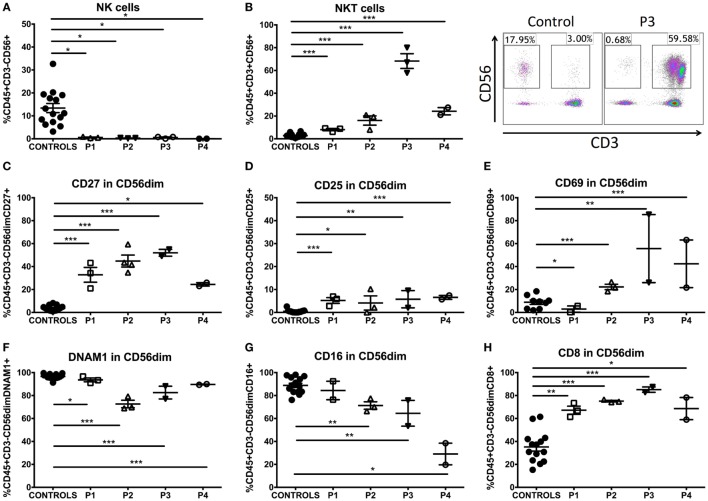
Figure 3.
NK- and NKT-cell phenotype in GATA2-deficient patients. (A) Percentage of NK cells (CD3−CD56+) of GATA2 patients and controls. (B) Percentage of NKT cells (CD3+CD56+) of GATA2 patients and healthy donors. (C) CD27 expression in CD56 dim NK cells. (D) CD25 expression in CD56 dim NK cells. (E) CD69 expression in CD56 dim NK cells. (F) DNAM1 expression in CD56 dim NK cells. (G) CD16 expression in CD56 dim NK cells. (H) CD8 expression in CD56 dim NK cells. Lines represent mean and bars represent the standard error of the mean. *P < 0.05; **P < 0.01; ***P < 0.001.

