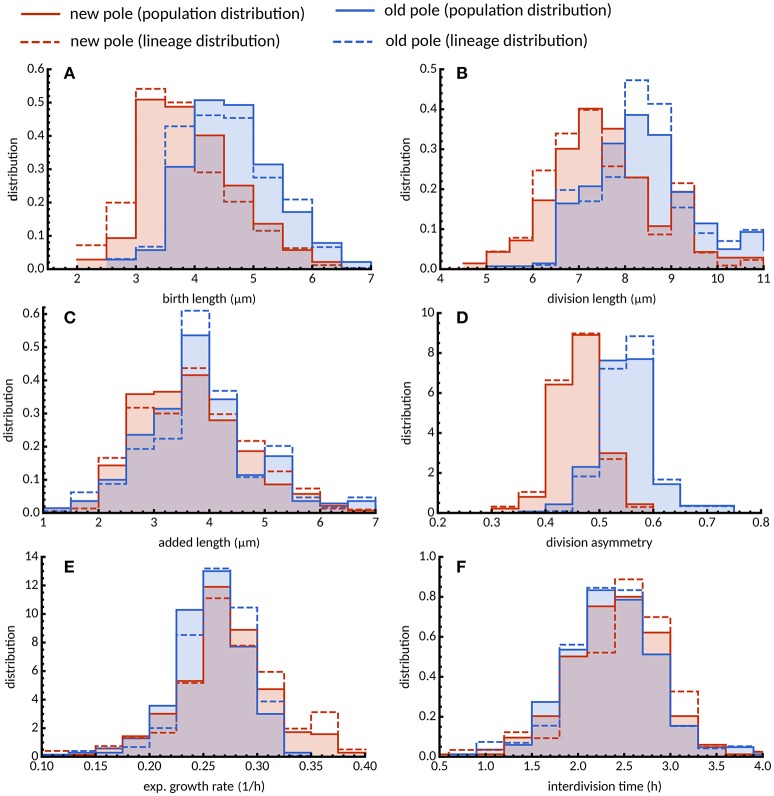
Figure 3.
Distribution of growth parameters for new- and old-pole cells grown in glycerol. Histograms of (A) birth length, (B) division length, (C) added length, (D) division asymmetry, (E) exponential growth rate, and (F) interdivision time are shown for new (red) and old pole cells (blue). Population average distributions taken over every single cell in the experiment (solid lines) are qualitatively similar compared to lineage-weighted distributions (dashed lines).

