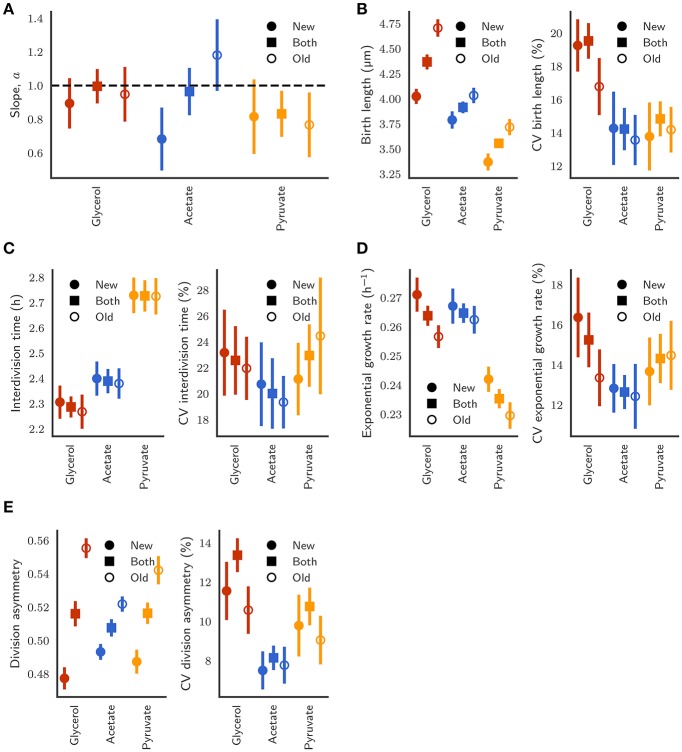
Figure 7.
(A) Comparison of the slope of the linear relationship between initial length and final length between new-pole (closed circles), old-pole (open circles), and both pole (closed squares) daughter cells. Error bars depict bootstrapped 95% confidence intervals. (B) Birth length and coefficient of variation (CV) of the distributions. (C) Interdivision time and CV. (D) Exponential growth rate and CV. (E) Division asymmetry and CV, where asymmetry is defined as the ratio of birth length to the sum of birth lengths of both siblings.

