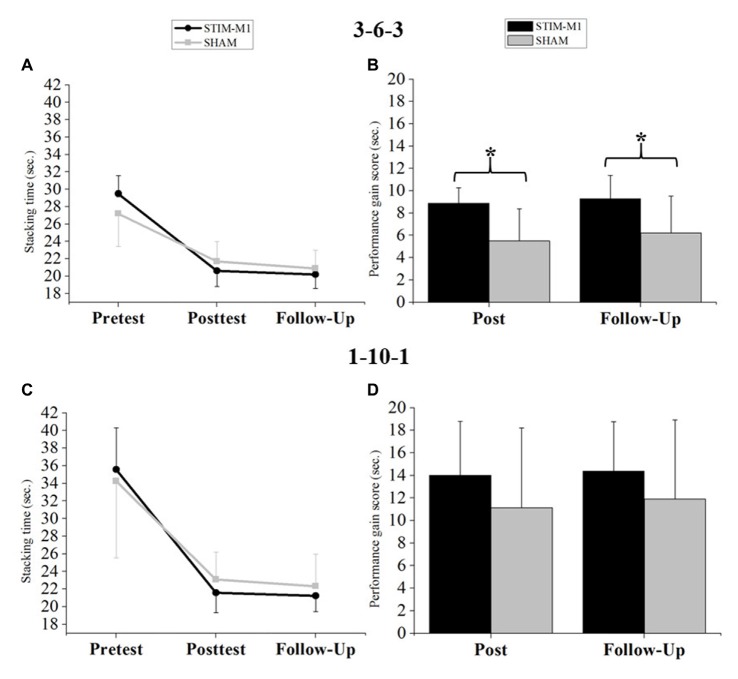
Figure 4.
(A) Analysis of variance (ANOVA; mixed design) for the 3-6-3 stack. (B) Differences in performance gain scores (s) between both groups in the 3-6-3 stack. (C) ANOVA (mixed design) for the 1-10-1 stack. (D) Differences in performance gain scores (s) between both groups in the 1-10-1 stack. Error bars indicating standard deviation (SD) and *p < 0.05.

