Fig. 1.
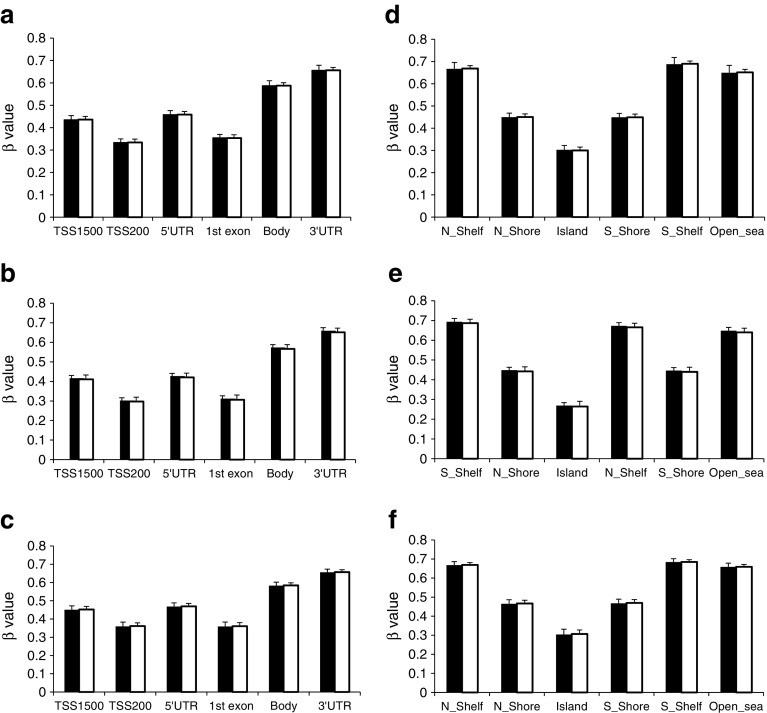
DNA methylation landscape in insulin-resistant vs insulin-sensitive women in SAT (a, d), VAT (b, e) and PBMCs (c, f). Based on Illumina annotation, 112,057 (SAT), 124,089 (VAT) and 99,462 (PBMCs) CpG probes were mapped to genome regions. We calculated the average level of DNA methylation within each of the insulin-resistant (black bars) and insulin-sensitive (white bars) groups stratified on genome region in relation to functional gene regions (a, b, d) and CpG content (d, e, f). TSS1500, within 1500 bp of transcriptional start site (TSS); TSS200, within 200 bp of TSS. Genome locations: Island, CpG island; N_Shelf, upstream CpG island shelf; N_Shore, upstream CpG island shore; S_Shore, downstream CpG island shore; S_Shelf, downstream CpG island shelf; Open_sea; other CpG regions

