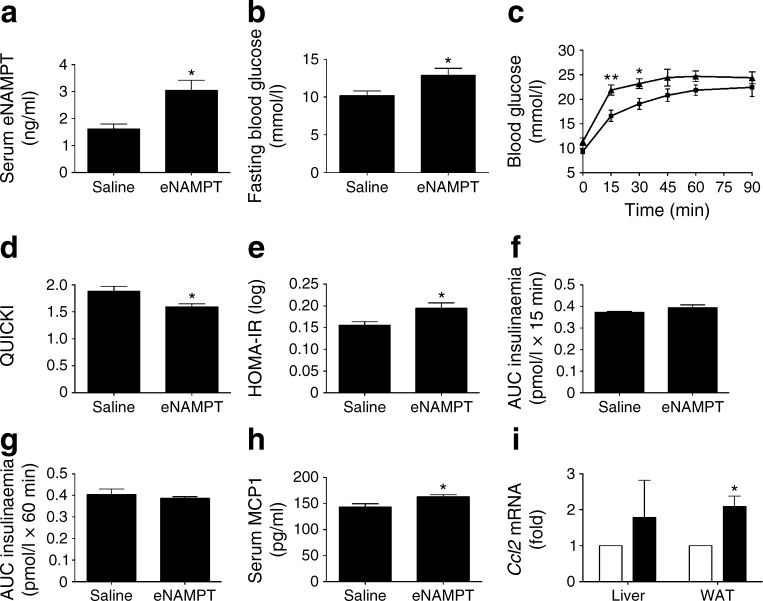
Fig. 6.
eNAMPT-monomer administration for 14 days induces a diabetic phenotype in mice. (a) Serum eNAMPT levels, (b) blood glucose levels, (c) IPGTT (squares, saline; triangles, eNAMPT), (d) QUICKI and (e) HOMA-IR in mice injected i.p. with recombinant eNAMPT-monomer or the equivalent volume of 154 mmol/l NaCl. AUC insulin response to IPGTT at (f) 0–15 min and (g) 15–60 min, (h) serum MCP1 levels and (i) Ccl2 gene expression (white bars, saline; black bars, eNAMPT). *p < 0.05, **p < 0.01

