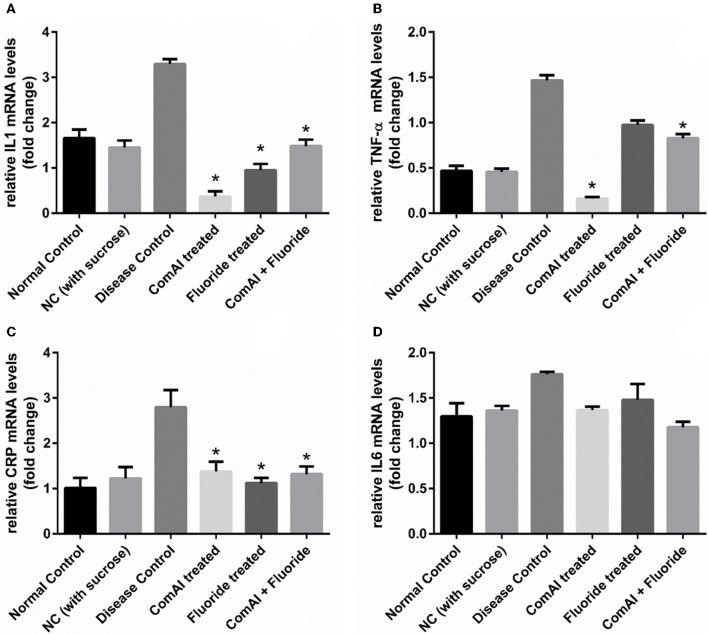
Figure 10.
qRT-PCR analysis of inflammatory markers in samples collected from the blood plasma of Wistar rats. (A) IL-1; (B) TNF-α; (C) C-Reactive Protein (CRP); (D) IL-6. The results are represented as ratios corresponding to the fold change in various treatment groups when compared with normal control group (without treatment). Gapdh gene was used as an internal control for data normalization. *Indicates significantly different (p < 0.05) compared to untreated tissues.

