
Figure 2.
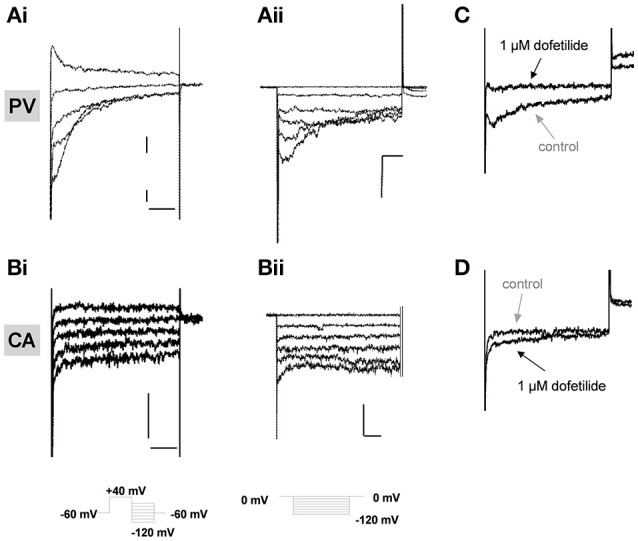
Electrophysiological recordings in isolated vascular myocytes. Examples of K+ currents recorded from portal vein (PV, A) or carotid artery (CA, B) myocytes in external solutions containing either 5 mM K+ (i) or 140 mM K+ (ii). Voltage protocols shown as inserts. All scale bars represent 50 pA and 50 ms. Panels (C,D) show representative traces in control conditions (gray arrows) or in presence of 1 μM dofetilide (black arrows) on currents recorded at −100 mV in PV (C) and CA (D) following a step depolarization from −50 to +40 mV. All traces are representative of >5 cells from at least 3 animals.