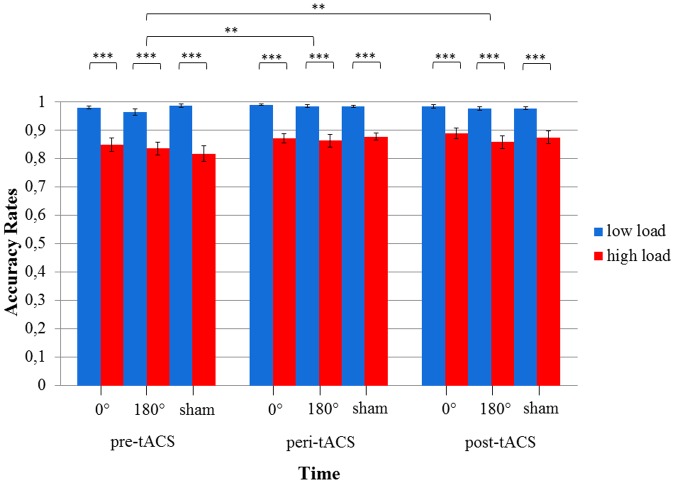
FIGURE 6.
Diagram of accuracy rates during the visuospatial match-to-sample task. Significant differences between low and high load in each of the three stimulation conditions (0° = in-phase, 180° = anti-phase, and sham) for pre-, peri-, and post-tACS as well as significant differences between pre-, peri-, and post-tACS are shown. (∗∗∗p < 0.001; ∗∗p < 0.05) Standard error bars are displayed.

