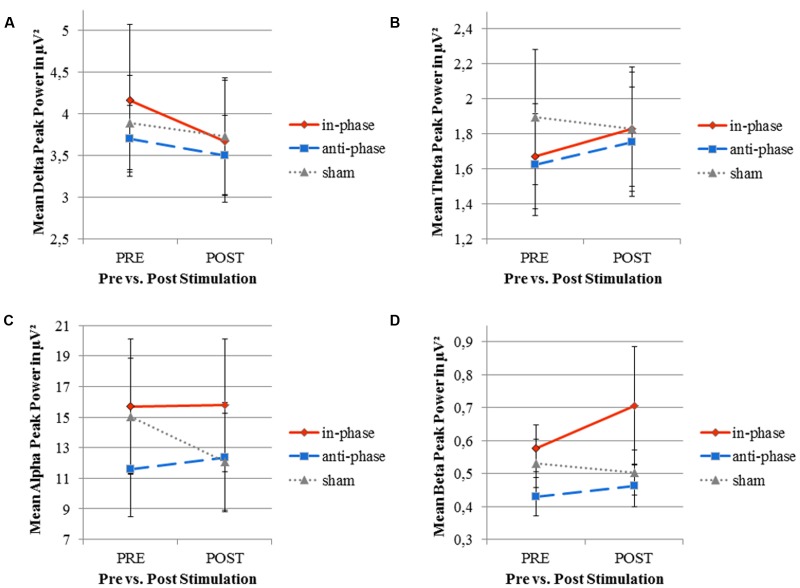
FIGURE 8.
Mean peak power of resting EEG (delta, theta, alpha, and beta frequency bands) before and after stimulation for the three stimulation conditions (in-phase, anti-phase, and sham). (A) Delta frequency range (0.5-4 Hz). (B) Theta frequency range (4-8 Hz). (C) Alpha frequency range (8-12 Hz). (D) Beta frequency range (12-30 Hz). Peak power (in μV2) was averaged across five electrodes within direct vicinity of the stimulation sites, i.e., Fz, F8, Pz, P8, and Oz. Standard error bars are displayed.

