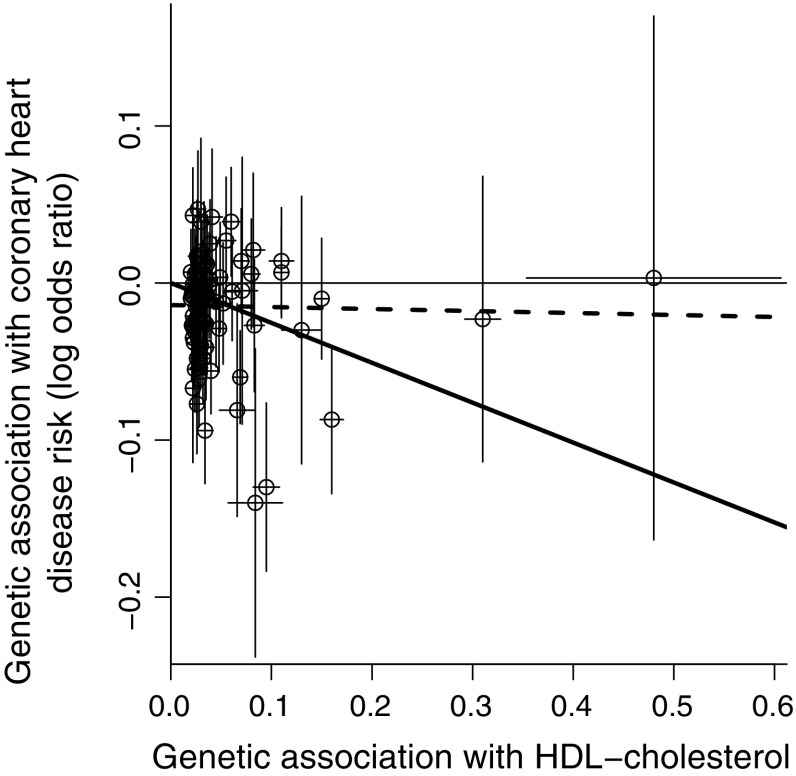
Fig. 7.
Graph showing further real example in which inverse-variance weighted estimate (solid line) and MR-Egger estimate (dashed line) differ substantially. Each point represents the per allele associations of a single genetic variant (lines from each point are 95% confidence intervals for the associations). Associations with HDL-cholesterol are in standard deviation units and associations with CHD risk are log odds ratios

