Fig. 9.

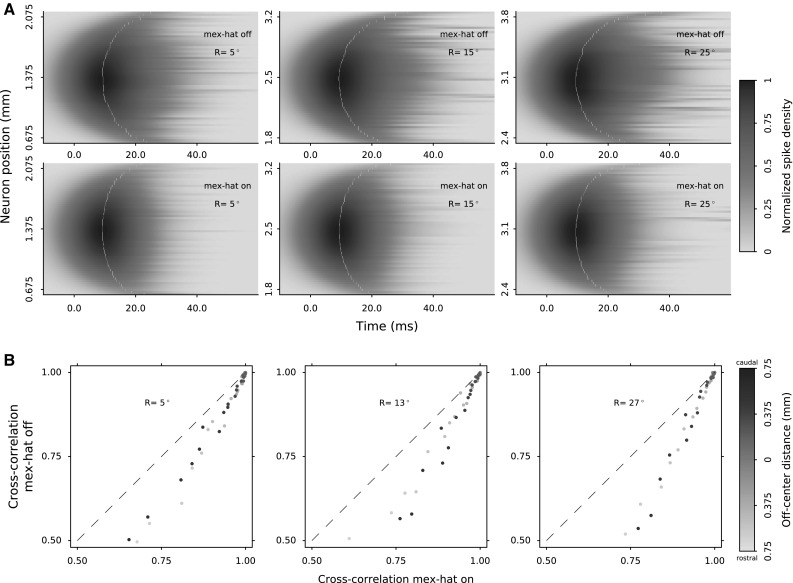
a Lateral connections synchronize the burst profiles of the neurons in a recruited population. Simulation results without lateral connections (top row in a) display poorer network performance compared to the synchronized activity via lateral connections (bottom row in a). Population activities are normalized by the peak firing rate of the central cell in each population. The peak firing moments are marked to highlight improved temporal aligning via lateral interactions, especially in the population centers. b Cross-correlation of the burst profiles of the central neuron with the other recruited neurons. Each data point depicts cross-correlations between the neuron pair with and without lateral connections. Neuron’s distance to the population center is color-coded. Dashed lines depict the diagonal unity line. The points below the dashed lines are in favor of lateral connections. Note that this comparison is possible when the lateral connections do not affect the size and total spike counts of the active populations (shown in Fig. 10)
