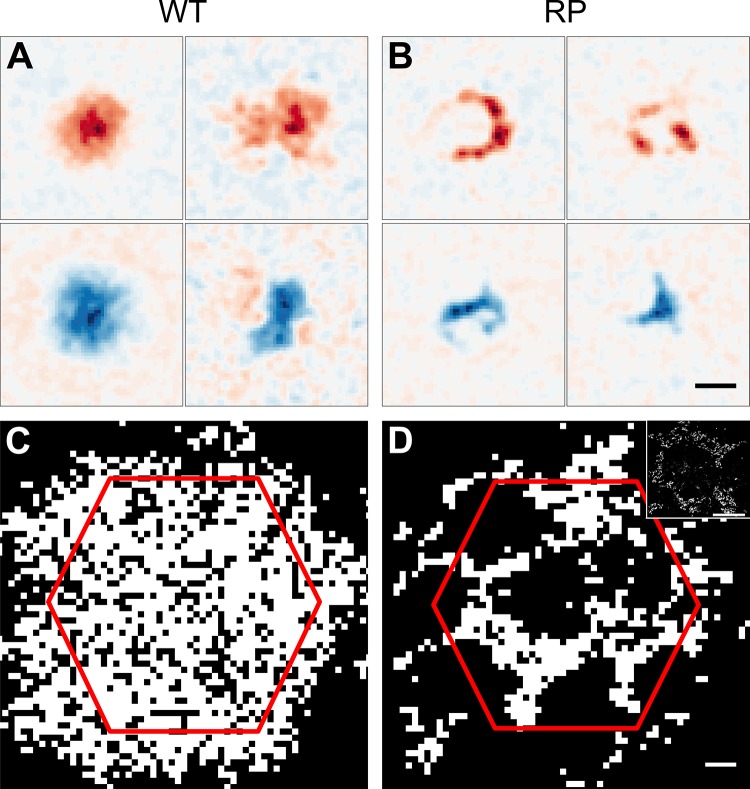
Fig. 2.
Functional changes in spatial sensitivity in S334ter-3 retina. A: spatial RFs of two ON and two OFF RGCs from WT retina. Red (blue) indicates sensitivity to increments (decrements) of light. B: spatial RFs from S334ter-3 (RP) retina. RFs exhibit holes and arc-like shapes. Scale bar, 150 μm. C: binary map indicating locations of high (white) vs. low (black) sensitivity to light cumulated across all recorded RGCs from a WT retina. D: same as C for S334ter-3 retina. Scale bar, 50 μm. Inset: micrograph shows the outer segments of cones from S334ter-3 retina at the same scale as the sensitivity map. Red hexagon in C and D is the MEA border. Scale bar, 100 μm.

