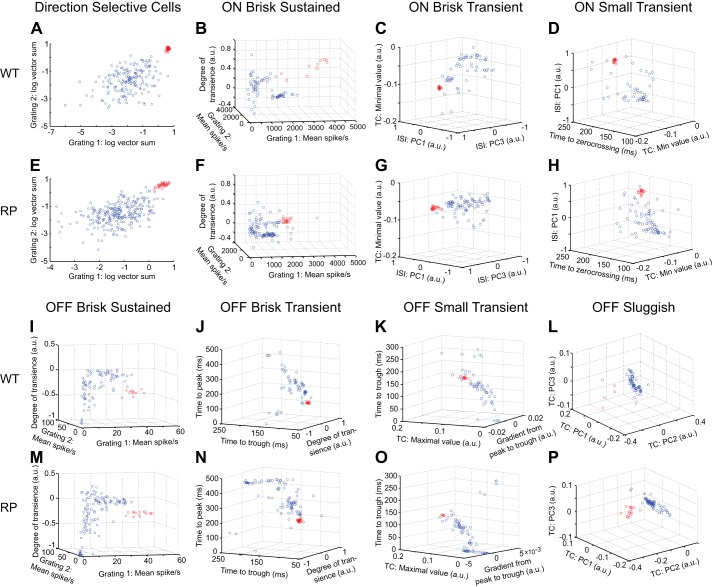
Fig. 3.
Functional classification of RGCs in WT and S334ter-3 retinas. A: identification of DS RGCs in one WT retina (WT3 in Table 1). Scatter plot shows vector sums to a high- and a low-speed drifting grating for all RGCs in one recording (gratings 1 and 2; spatial periods 512 μm, temporal periods 0.5 and 2.0 s). Data points show results of a 2-Gaussian mixture model fit. Red points are DS RGCs. B: classification of ON brisk sustained (BS) RGCs. Scatter plot shows indicated response parameters measured from all ON RGCs. Data points show results of a 2-Gaussian mixture model fit. Red points are identified ON BS RGCs. C: scatter plot showing all ON RGCs with ON BS cells removed. Data points show results of a 2-Gaussian mixture model fit to points; red points are identified ON brisk transient (BT) RGCs. D: scatter plot of remaining ON RGCs in the indicated parameter space. Data points show the results of a 2-Gaussian mixture model fit; red are identified ON small transient (ST) RGCs. E–H: same conventions as A–D but showing results of classification of each RGC type from one S334ter-3 recording (RP1 in Table 1). I–L: result of serial classification for OFF BS, BT, ST, and OFF sluggish RGCs. I shows all OFF cells, J shows all OFF cells with OFF BS cells removed, K shows all OFF cells with OFF BS and BT removed, and L shows all OFF cells with OFF BS, BT, and ST removed. Data points show the results of a 2-Gaussian mixture model fit; red points indicate the classified cells. M–P: same conventins as I–L, but for the S334ter-3 recording in E–H. a.u., Arbitrary units; TC, time course of temporal RF; PC1–PC3, principal components; ISI, interspike interval histogram.

