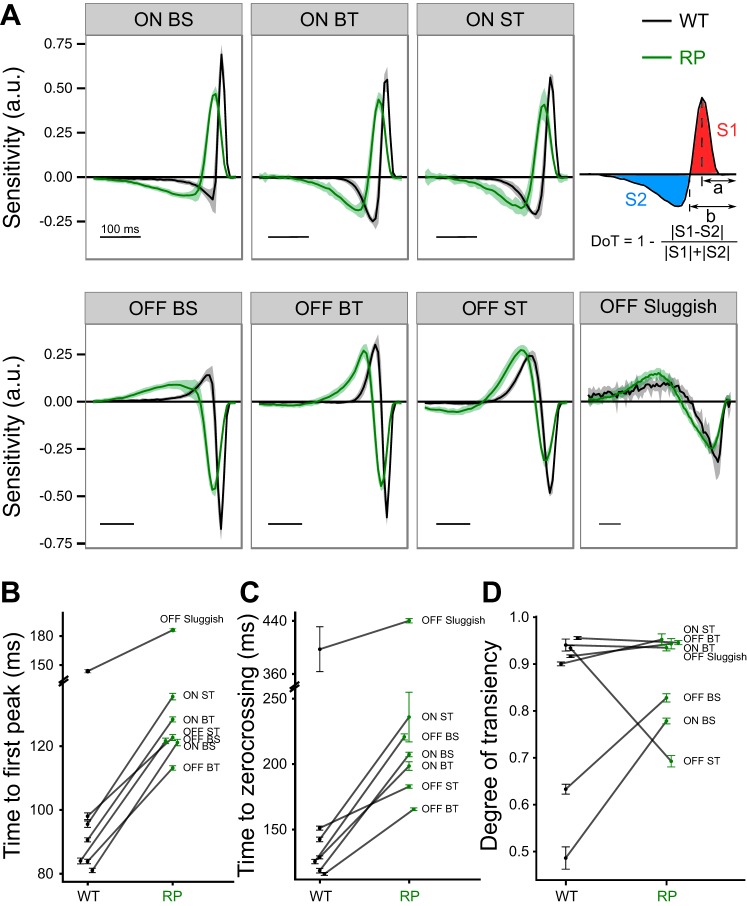
Fig. 8.
Changes in RGC temporal integration in S334ter-3 retinas. A: comparison of temporal RFs for 3 ON and 4 OFF RGC types in WT (black) and S334ter-3 retinas (green). Lines indicate mean values, and shaded areas show SE. Scale bar, 100 ms. Top right, illustration of extracted quantities from temporal RFs: time to first peak preceding spike (a), time to zero-crossing (b), and degree of transiency (DoT); S1 and S2 are areas under the curve. B–D: comparison of time to first peak (P < 0.0001 for all types; B), time to zero-crossing (C), and DoT (D) between WT and S334ter-3 retinas for 7 RGC types. Data points show mean and SE.

