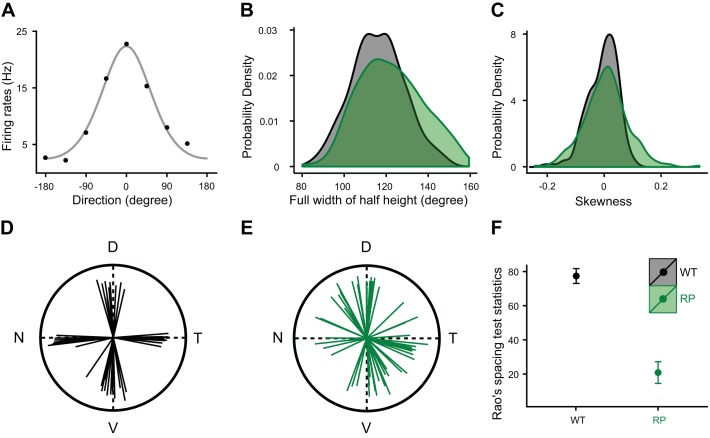
Fig. 9.
Direction tuning preferences are disrupted among DS-RGCs in S334ter-3 retina. A: direction tuning for a DS RGC from an S334ter-3 retina. Data points show average firing rates, and gray curve is a fitted von Mises function. B: distribution of tuning widths at half height for DS RGCs in WT (black) and S334ter-3 retinas (green). C: skewness distribution of tuning curves for DS RGCs in WT (black) and S334ter-3 retinas (green). D and E: directional preferences of DS cells in one WT (D) and one S334ter-3 retina (E). D, dorsal; T, temporal; V, ventral; N, nasal. F: homogeneity test for the distribution of preferred directions (mean and SE).

