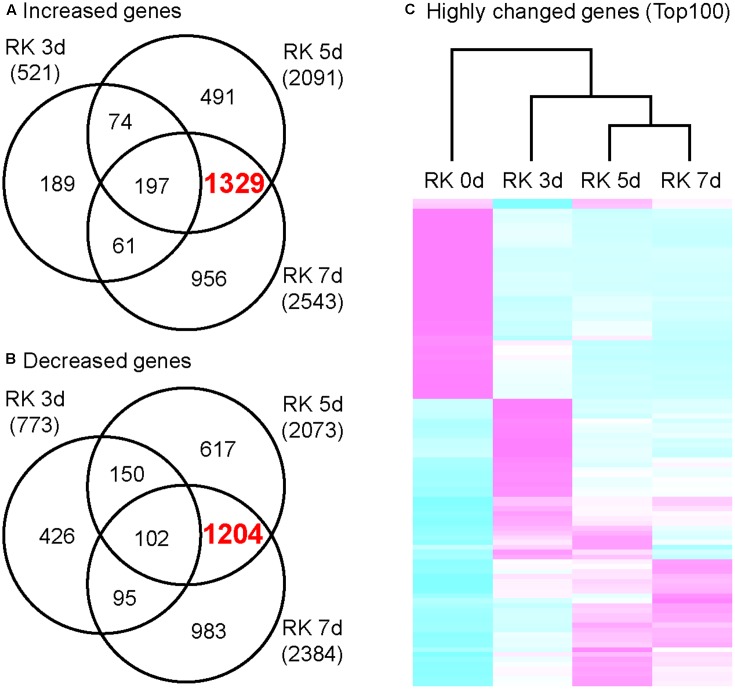
FIGURE 2.
Transcriptome analysis of growing galls in the in vitro assay system. Venn diagrams that depict the number of genes increased (A) and decreased (B) in galls. Genes shown here all show at least twofold changes in expression relative to non-treated roots. (C) Comparison of differentially expressed genes that were determined by top 100 of FDR value. Magenta indicates genes increased compared to median levels of the four samples, whereas cyan means decreased amount of mRNA.

