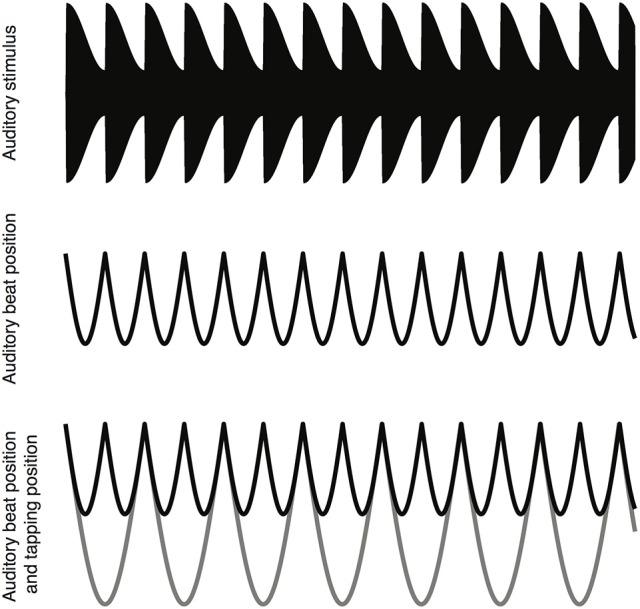
Figure 1.

A schematic depiction of the task. A six second sample of the auditory stimulus waveform (top). The location of the auditory beats (middle). The location of the auditory beats (black line) and the location of the finger taps (gray line) (bottom).
