
Figure 5.
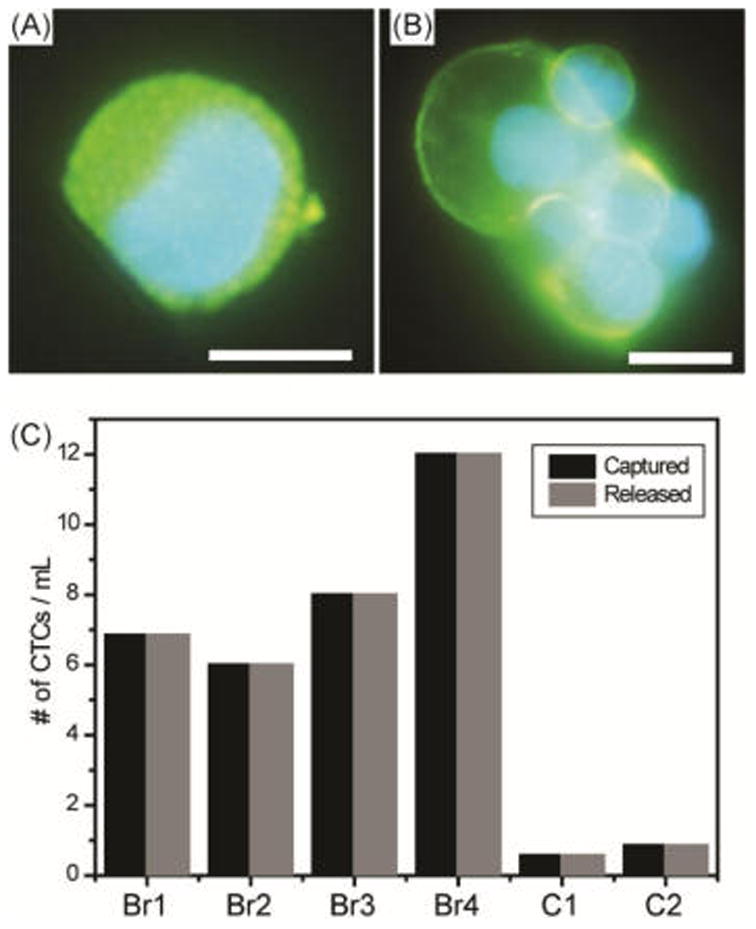
Immunofluorescence staining of cell-surface receptors of a captured (A) single CTC and (B) CTC cluster from a metastatic breast cancer patient. The images shown include EpCAM/CDH11 staining in Alexa Fluor 488 and DAPI nuclear staining in blue (scale bar = 10 μm). (C) Captured and released CTC counts from breast metastatic patients (Br1–Br4) and healthy controls (C1–C2).