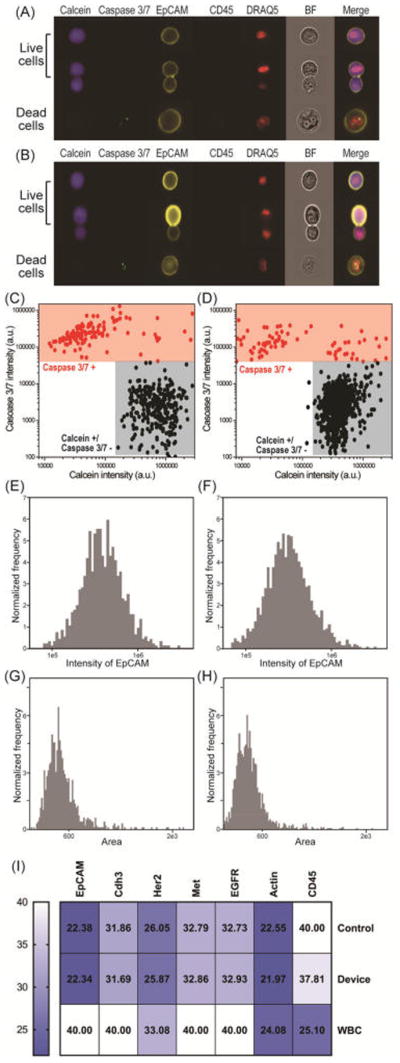
Figure 6.

Characterization of the patient-derived breast (Brx) CTC line using imaging flow cytometry. Data compare viability, EpCAM expression, and area of control versus captured/released cells from our NP-HBCTC-Chip. Representative images of one viable, cluster, and dead Brx cell (A) obtained from culture (control) and (B) captured/released from our microfluidic device. Gate settings of (C) control and (D) captured/released Brx cells. Viable cells are defined as calcein positive and caspase 3/7 negative, whereas dead cells are caspase 3/7 positive. The intensity of EpCAM obtained from (E) control and (F) captured/released Brx cells. The area of (G) control and (H) captured/released Brx cells. (I) Heat map of the Ct values of seven genes obtained by RT-qPCR. Comparisons were across control, released Brx cells, and white blood cells (WBC).
