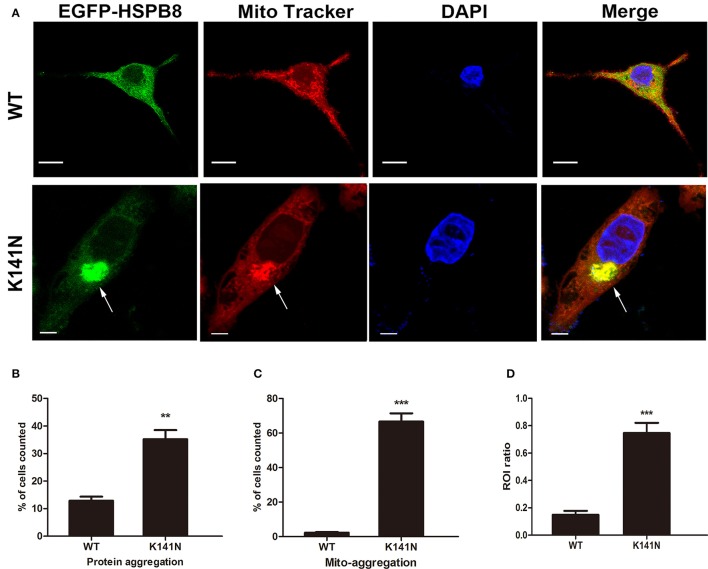
Figure 2.
K141N HSPB8 induced mitochondria aggregation in SH-SY5Y cells. (A) Representative confocal microscopic images of SH-SY5Y cells transfected with WT or K141N HSPB8 constructs. Nucleus is shown in blue, arrows show the aggregated mitochondria (red) and its co-localization with aggregated K141N HSPB8 (green). Scale bars = 10 μm. (B,C) Quantitative analysis of the ratio of K141N HSPB8 proteins to form aggregates and the aggregated mitochondrial co-localization with HSPB8. (D) Quantitative analysis of the ROI ratio in WT and K141N HSPB8 groups. Error bars represent ± SEM values and n = 3. Approximately 100 transfected cells were counted in each experiment. **p < 0.01, ***p < 0.001 compare to the WT HSPB8.

